Retail Sentiment Signals Trouble For U.S. Equities

Investor sentiment is one of the pillars of behavioral finance and defines the general attitude towards future market prices. Investors form their opinion based on facts and their gut feeling. Fundamental and technical factors are examples of facts, whereas stories and opinions of other investors are examples of narratives, which contribute to attitudes.
Investor sentiment is important because it affects the fundamental principles of asset pricing. There has been plentiful of evidence-based research published on the topic of investor sentiment. The consensus among researchers is that extreme readings of investor sentiment tend to be a contrarian indicator. Excessive levels are associated with subsequently surprising asset returns to the opposite direction of expectations. Hence, strongly bearish expectations were followed by positive returns, whereas negative returns followed strongly bullish expectations.
Some examples of research publications on the subject of investor sentiment and equity returns are:
- Baker, Malcolm, and Jeffrey Wurgler. 2004. "Investor Sentiment and the Cross-Section of Stock Returns“ NBER Working Paper No. 10449
- Stambaugh, Robert F. and Yu, Jianfeng and Yuan, Yu, The Short of It: Investor Sentiment and Anomalies (October 13, 2011). Journal of Financial Economics (JFE), Vol. 104, pp 288-302, May 2012
- Huang, Dashan and Jiang, Fuwei and Tu, Jun and Zhou, Guofu, Investor Sentiment Aligned: A Powerful Predictor of Stock Returns (October 13, 2014). Review of Financial Studies 28, 791-837, 2015
-Zhi Da, Joseph Engelberg, Pengjie Gao, The Sum of All FEARS Investor Sentiment and Asset Prices, The Review of Financial Studies, Volume 28, Issue 1, January 2015, Pages 1–32
-Tetlock, Paul C., Giving Content to Investor Sentiment: The Role of Media in the Stock Market. Journal of Finance, Forthcoming
Investor sentiment indicators aim to quantify the attitude of various cohorts. Some examples are the AAII Sentiment Survey of individual investors, the NAAIM Exposure Index of active investment managers, and the DSI of small traders. All of the above are examples of survey-based indicators. Other methods estimate sentiment with market-based measures or by algorithmic data mining. Put/Call Parity, the VIX Index, and closed-end fund premium are examples of market-based measures. The extraction of information about investors' mood from the media is based upon algorithmic mining of big data.
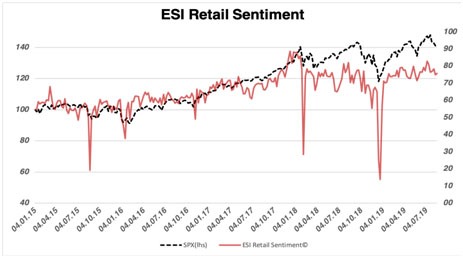
The ESI Retail Sentiment Index is a gauge for retail investors’ risk inclination. It is an algorithmic data mining indicator that extracts information from public sources on the internet. The indicator aggregates risk-relevant terms and constructs a time series from that. An overlay to the S&P 500 index shows the behavior of the sentiment gauge during the past years. It reveals how fear unloaded among retail investors during 2018. Moreover, its evolution illustrates why stocks drop most often faster than they rally. Sentiment spiked to the downside during the early 2018 and late 2018 sell-offs. Notably, the late 2018 drop in equities unfolded sharply and erased two-year of equity gains within a couple of months.
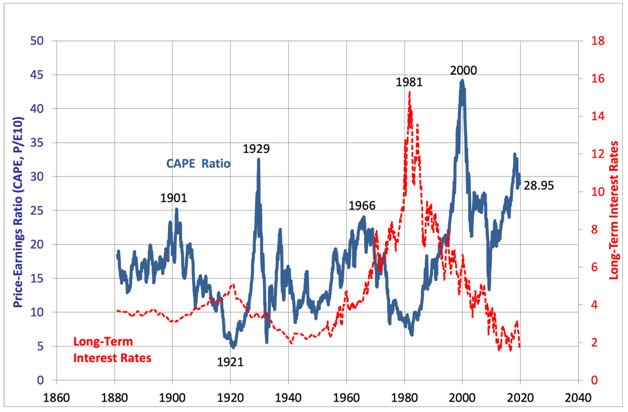
Retail investors' sentiment quickly recovered along with U.S. equities during 2019. Eventually, the index reached excessively optimistic territory at the end of last month. Comparable complacent measures occurred only in two instances since 2015. Those instances appeared during late 2017 and late 2018. Both previously extreme readings happened shortly before a significant correction unfolded. The euphoric retail sentiment reading in July 2019 arrived at an unfavorable junction. Last year, we showed that the current expansionary cycle is among the longest in U.S. history andconcluded a 90% probability for a recession within the next 18 months. Economic data trended to the downside since then, which appears to confirm our forecast. Meanwhile, aggregate valuations reached into extreme territory as well. The 10-year CAPE ratio, which is calculated by Robert J. Shiller, hit the second-highest mark in its 140-year history. The chart above shows that it is on par with its 1929 measure. It was only exceeded during the peak of the tech bubble in the year 2000. Both extreme readings were followed by significant corrections and proved as an unfavorable point to be invested in U.S. equities.
All in all, an evidence-based approach concludes a negative market outlook. The consensus among researchers is that excessive sentiment often leads to disappointing returns. Facts add up at the current junction as the signal arrives during a very late point of an expansionary cycle along remarkably expensive equity valuations. Therefore, we remain with our negative outlook and expect a correction during the next months.
Interested in more of our ideas? Check out Scienceinvesting for more details!
Interested in more of our ideas? Check out Scienceinvesting for more details!
Author

Science Investing Team
Science Investing


