|

Results & Update: The planets are taking a few days off

11/12 Recap: The S&P opened with a 6 handle gap up and then traded another 8 handles higher, for an opening minute high.  From that high,

The S&P declined 12 handles into a 9:39 AM low of the day.  From that low, the S&P traded in a 7 handle trading range, culminating with a low at 10:34 AM.  From that low, the S&P rallied 32 handles into a 12:01 PM high. From that high, the S&P gradually declined 11 handles into a 2:35 PM low.  From that low, the

S&P rallied 15 handles into a 3:36 PM high of the day.  From that high, the S&P declined 6 handles into the close.   


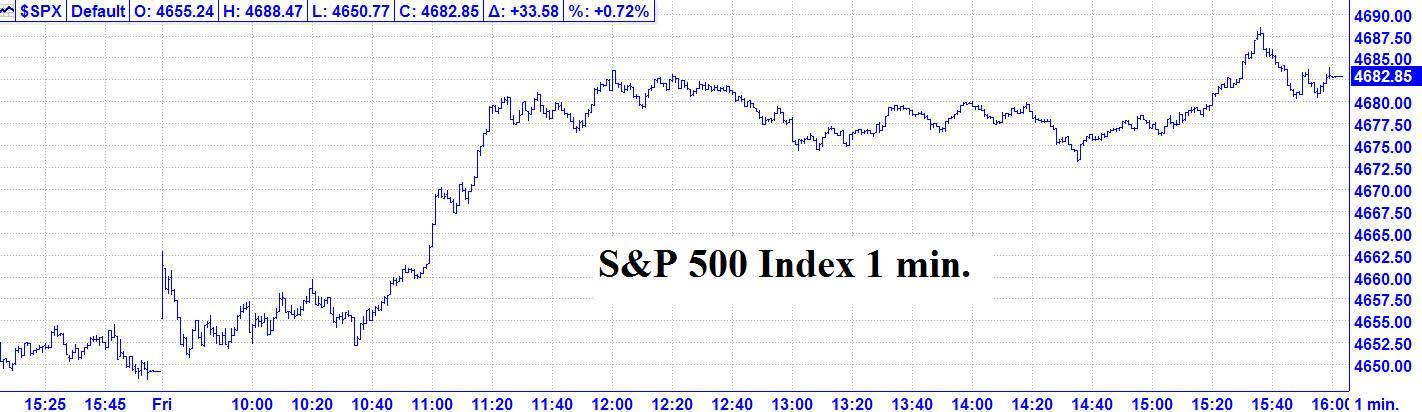
11//12 – The three major indices closed with a strong up day per the following closes: The DJIA + 179.08; S&P 500 + 33.58; and the

Nasdaq Composite + 156.68. 

Looking ahead  – We have one Fibonacci change in trend point for this weekend. The planets are taking a few days off. LOL! 

It should get very interesting toward the end of next week. 

The NOW Index is in the NEUTRAL ZONE. 


Coming Events:   

(Stocks potentially respond to all events).   

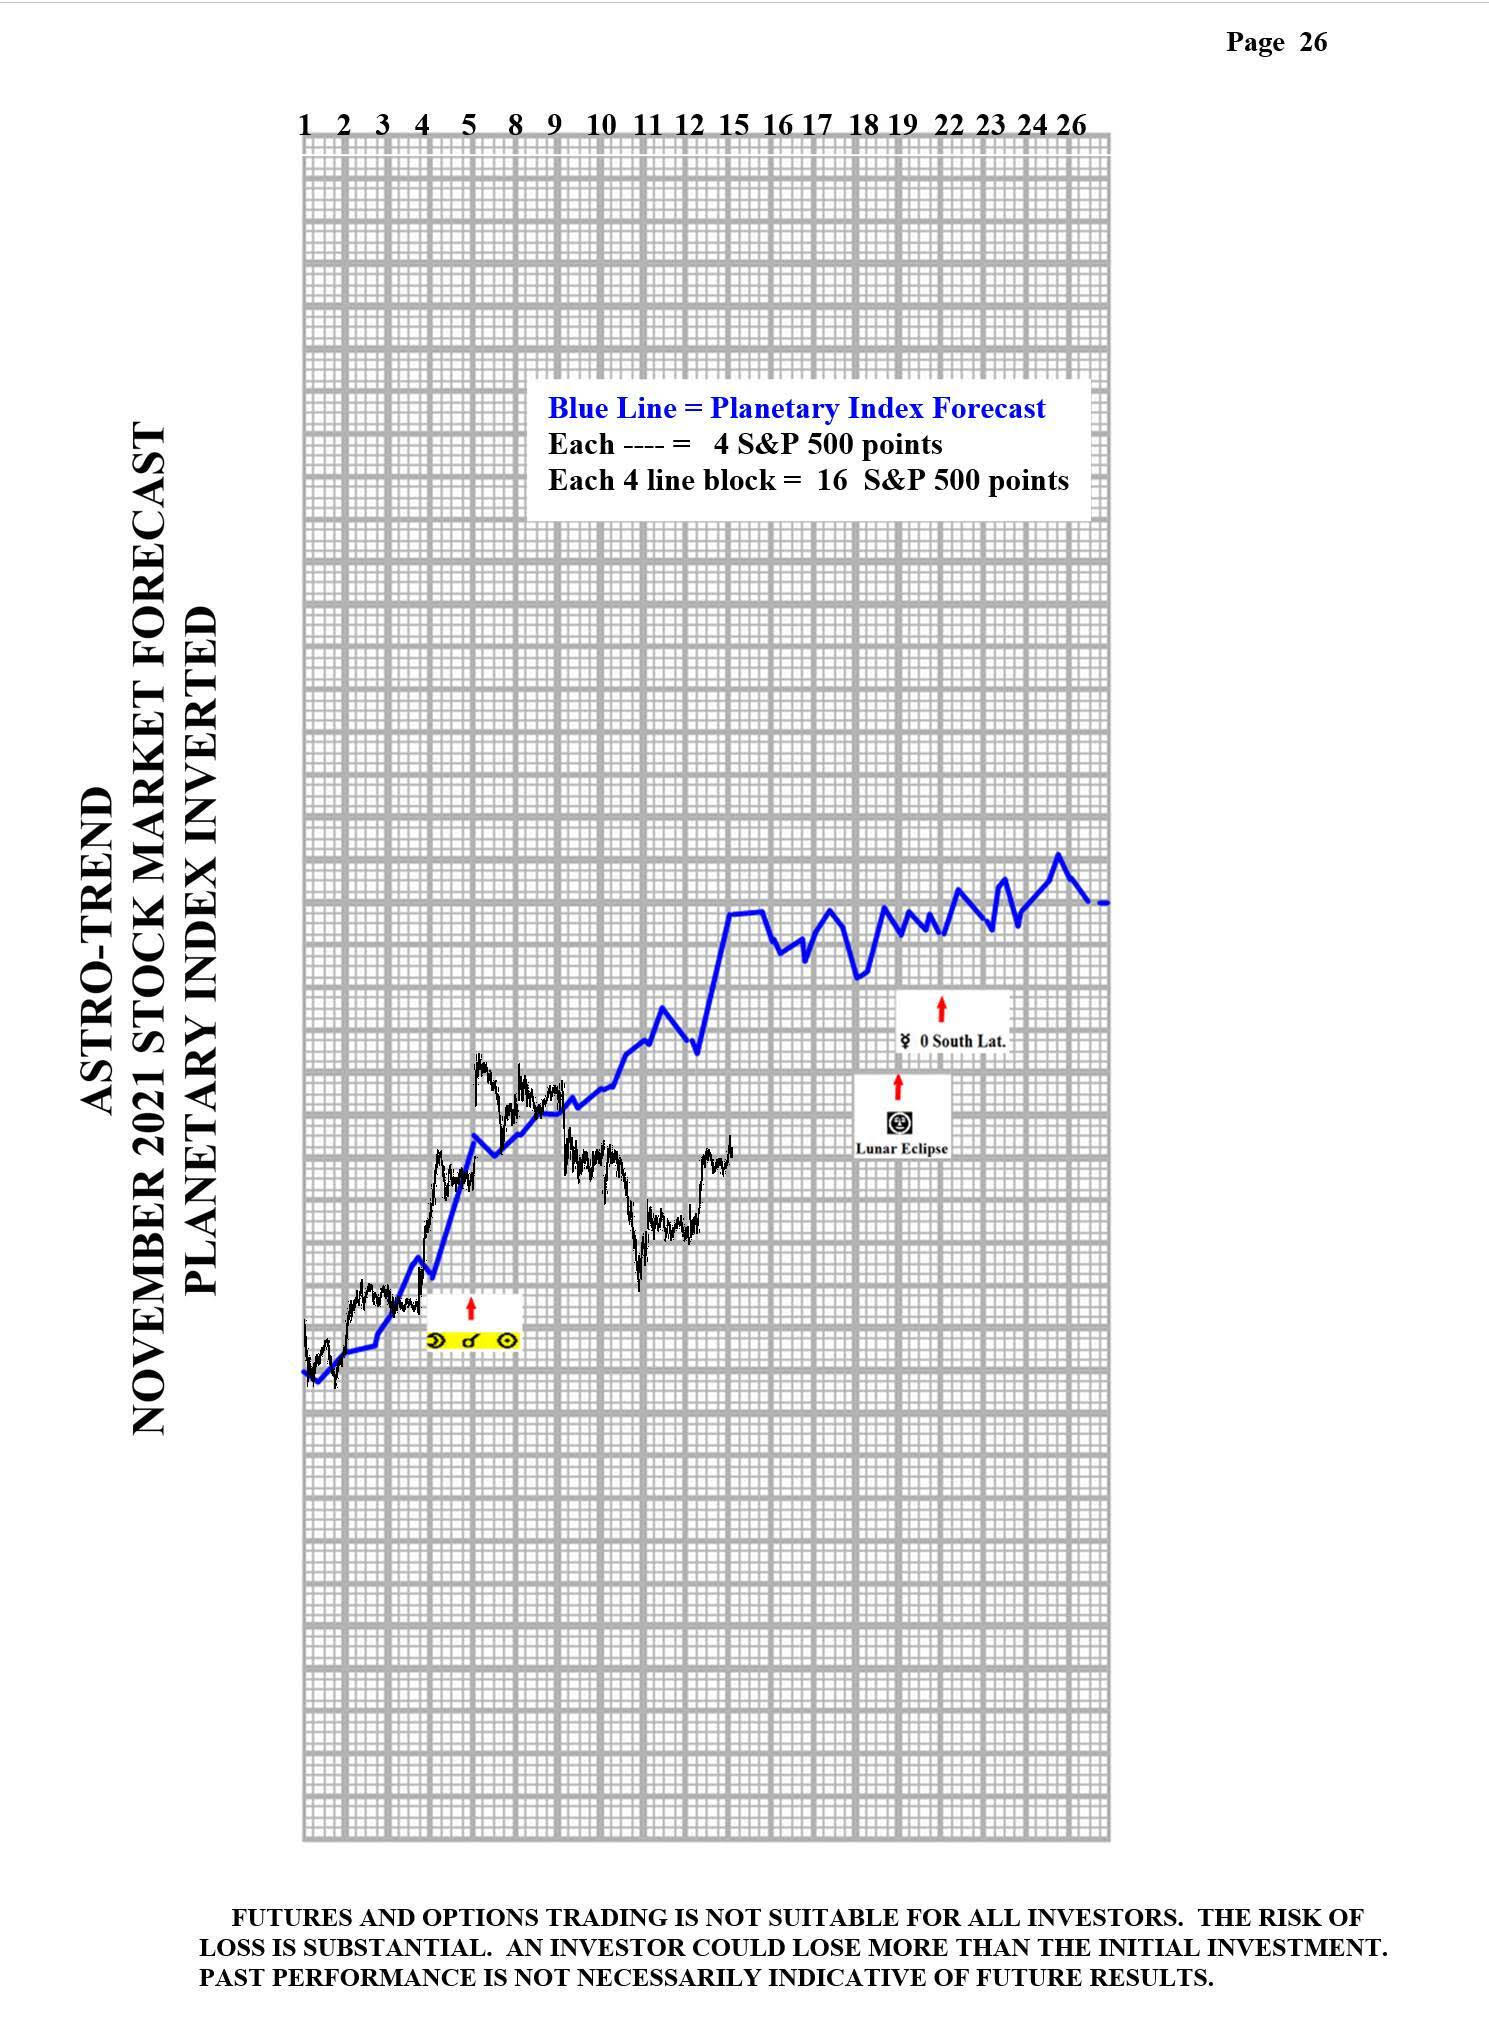
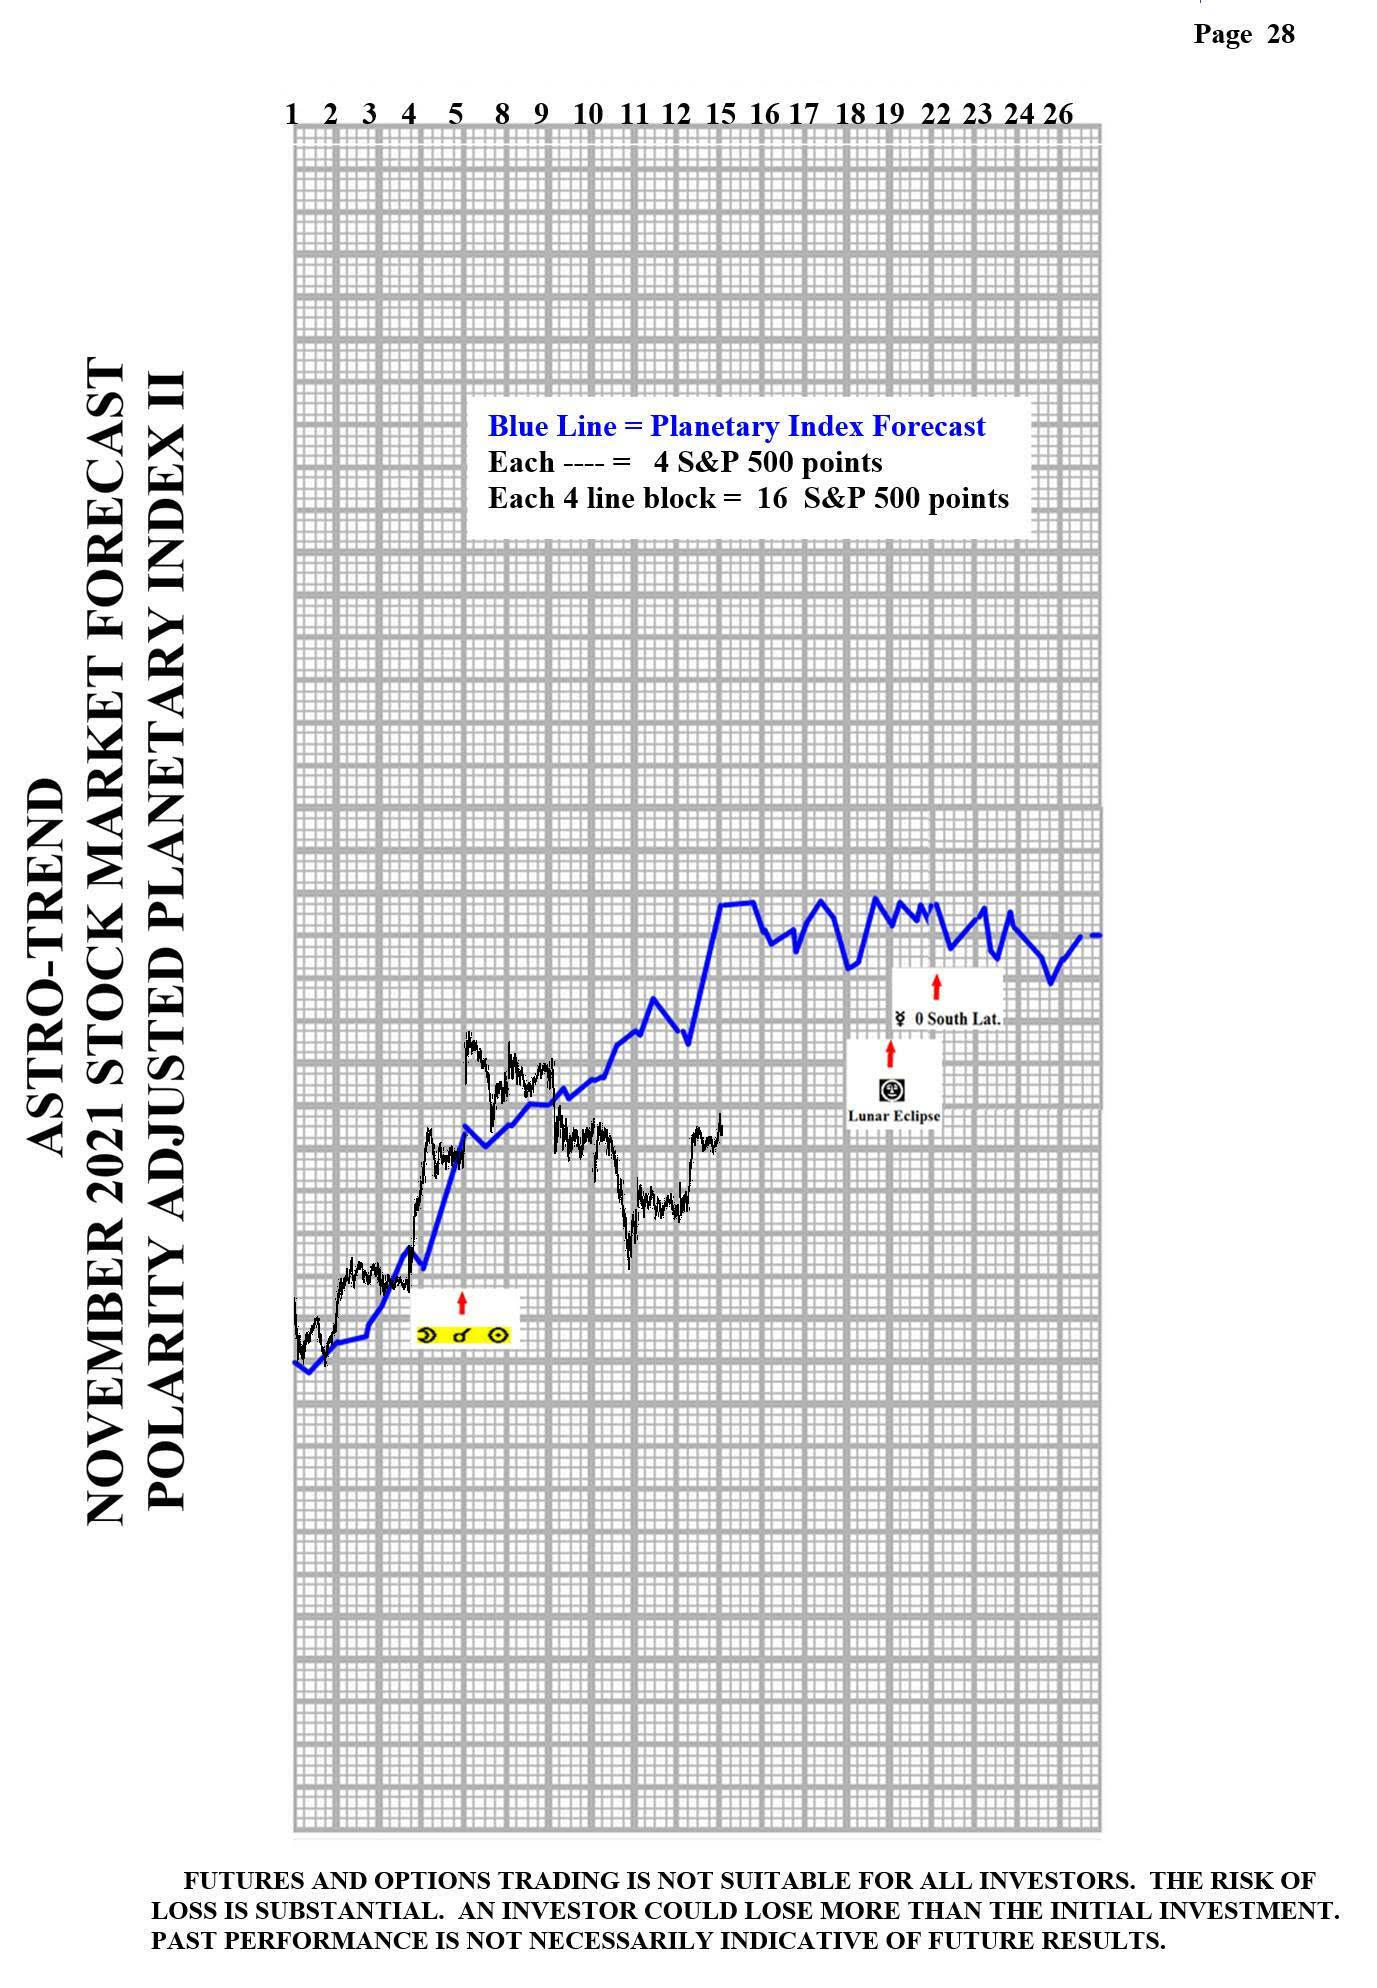
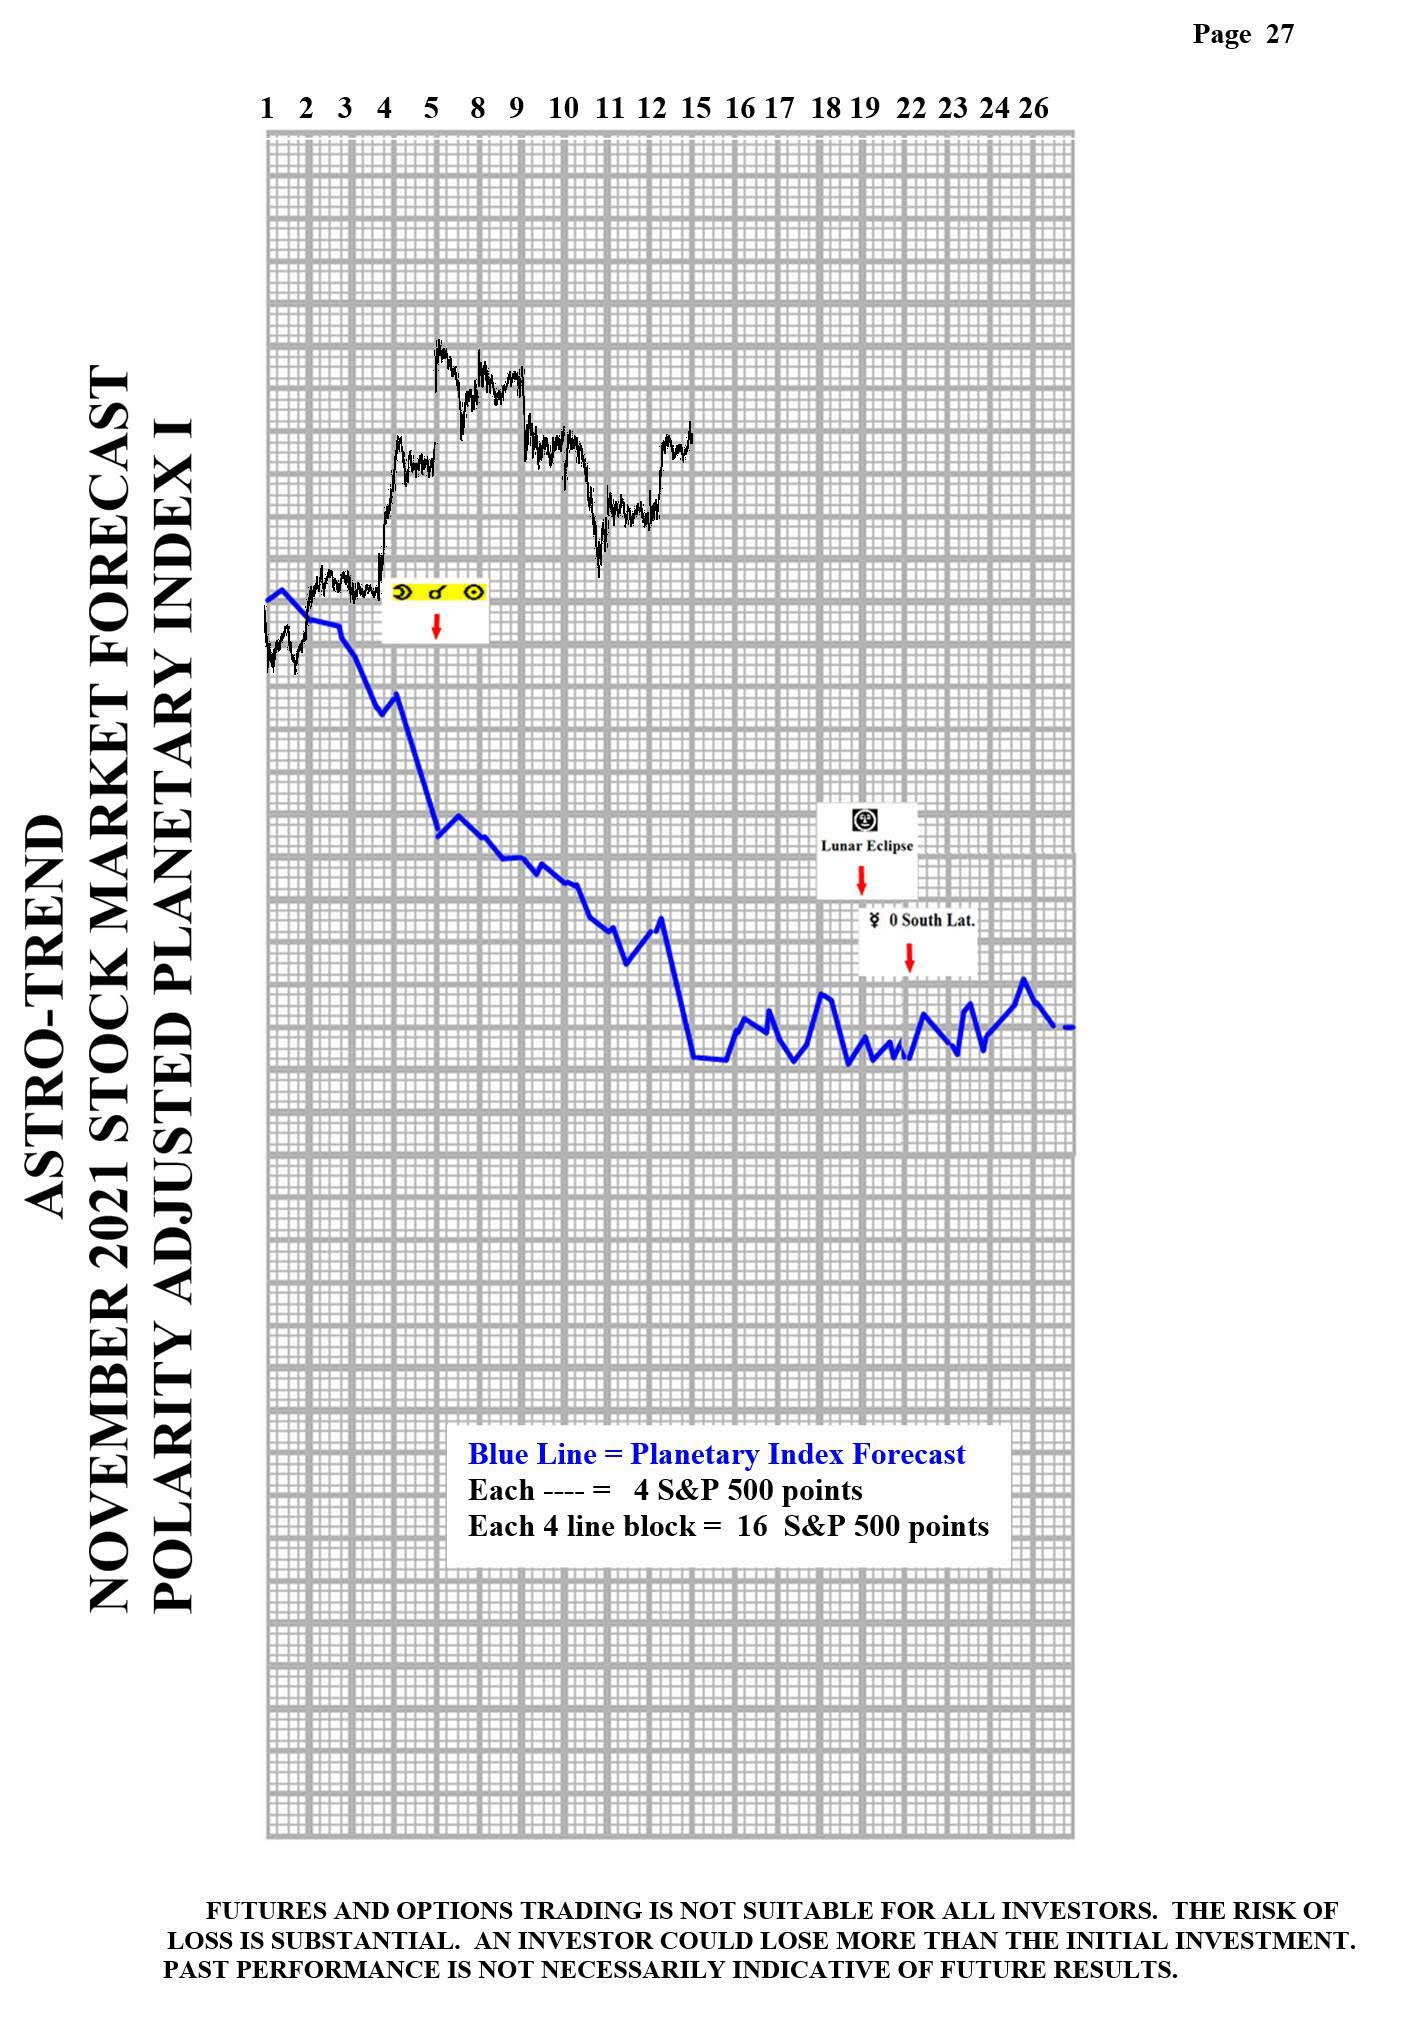
3. A. 11/18 AC – Full Moon/Lunar Eclipse in Taurus. Major Change in Trend Financials, Grains, Precious Metals and

    especially  Cattle and Cotton.

   B. 11/19 PM – Uranus 120 US Part of Fortune.  Major change in trend US Stocks, T-Bonds, US Dollar.

   C. 11/19 AC – Mercury 0 South Latitude. Major change in trend Corn, Oats, Soybeans, Wheat.      


Stock Market Key Dates –


Market Math –


11/29 – 5,161 Music Days from the major 10/11/2007 high. 

Fibonacci – 11/13, 11/19-22, 11/26.

Astro – 11/17, 11/19, 11/22, 11/26 

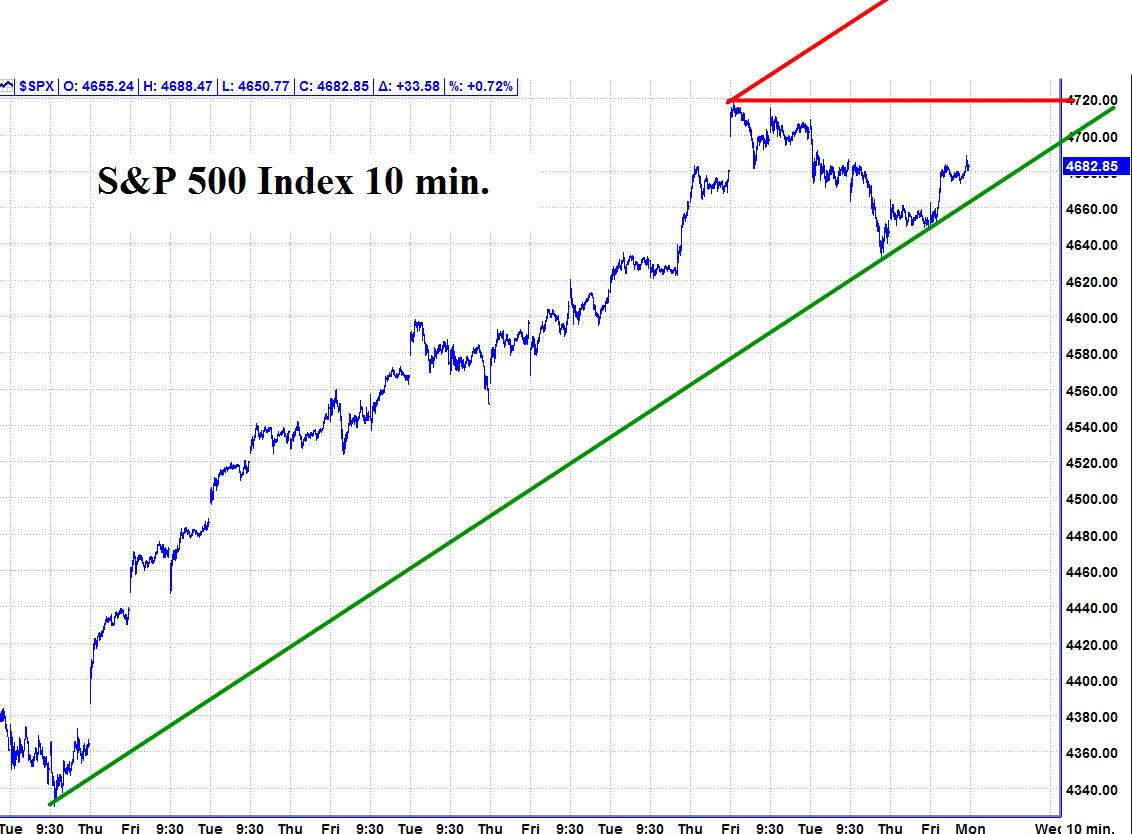
Please see below the S&P 500 10 minute chart.    

Looks like an inflexion point.  Something gotta give!                   

Support  - 4660  Resistance – 4720


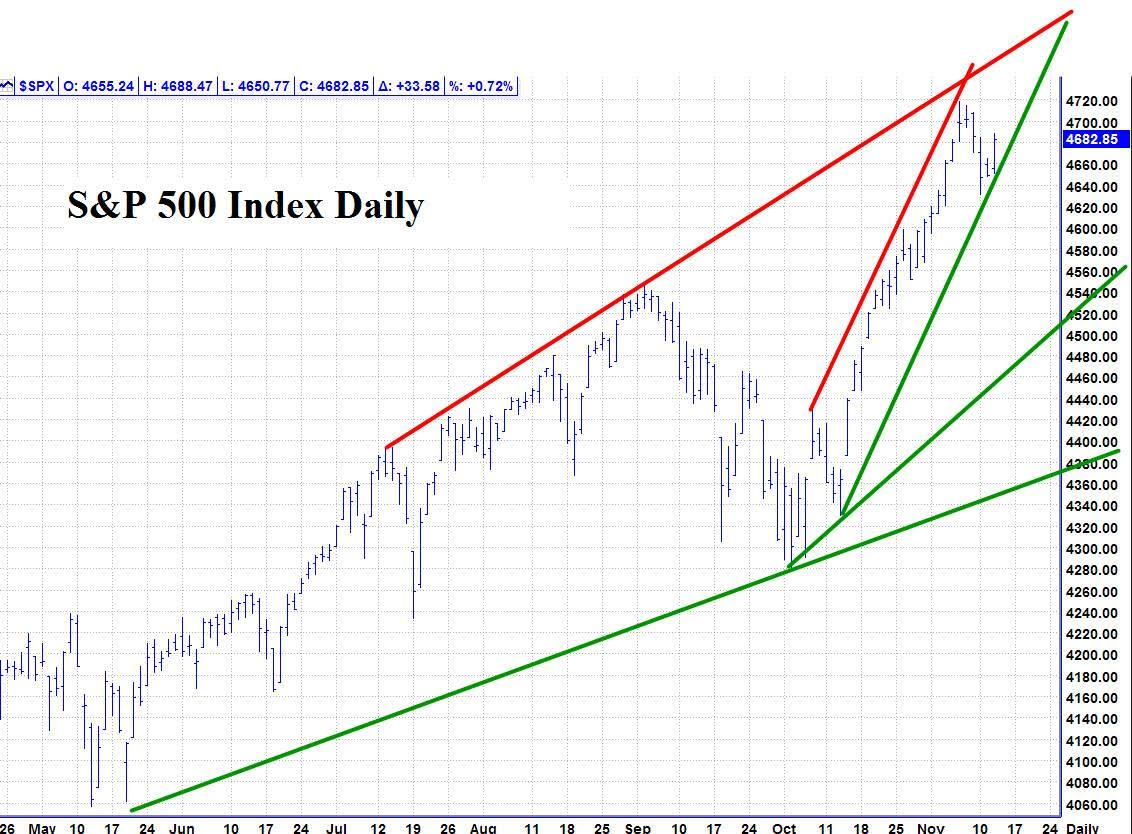
Please see below the S&P 500 Daily chart                                             

Support  - 4660  Resistance – 4720


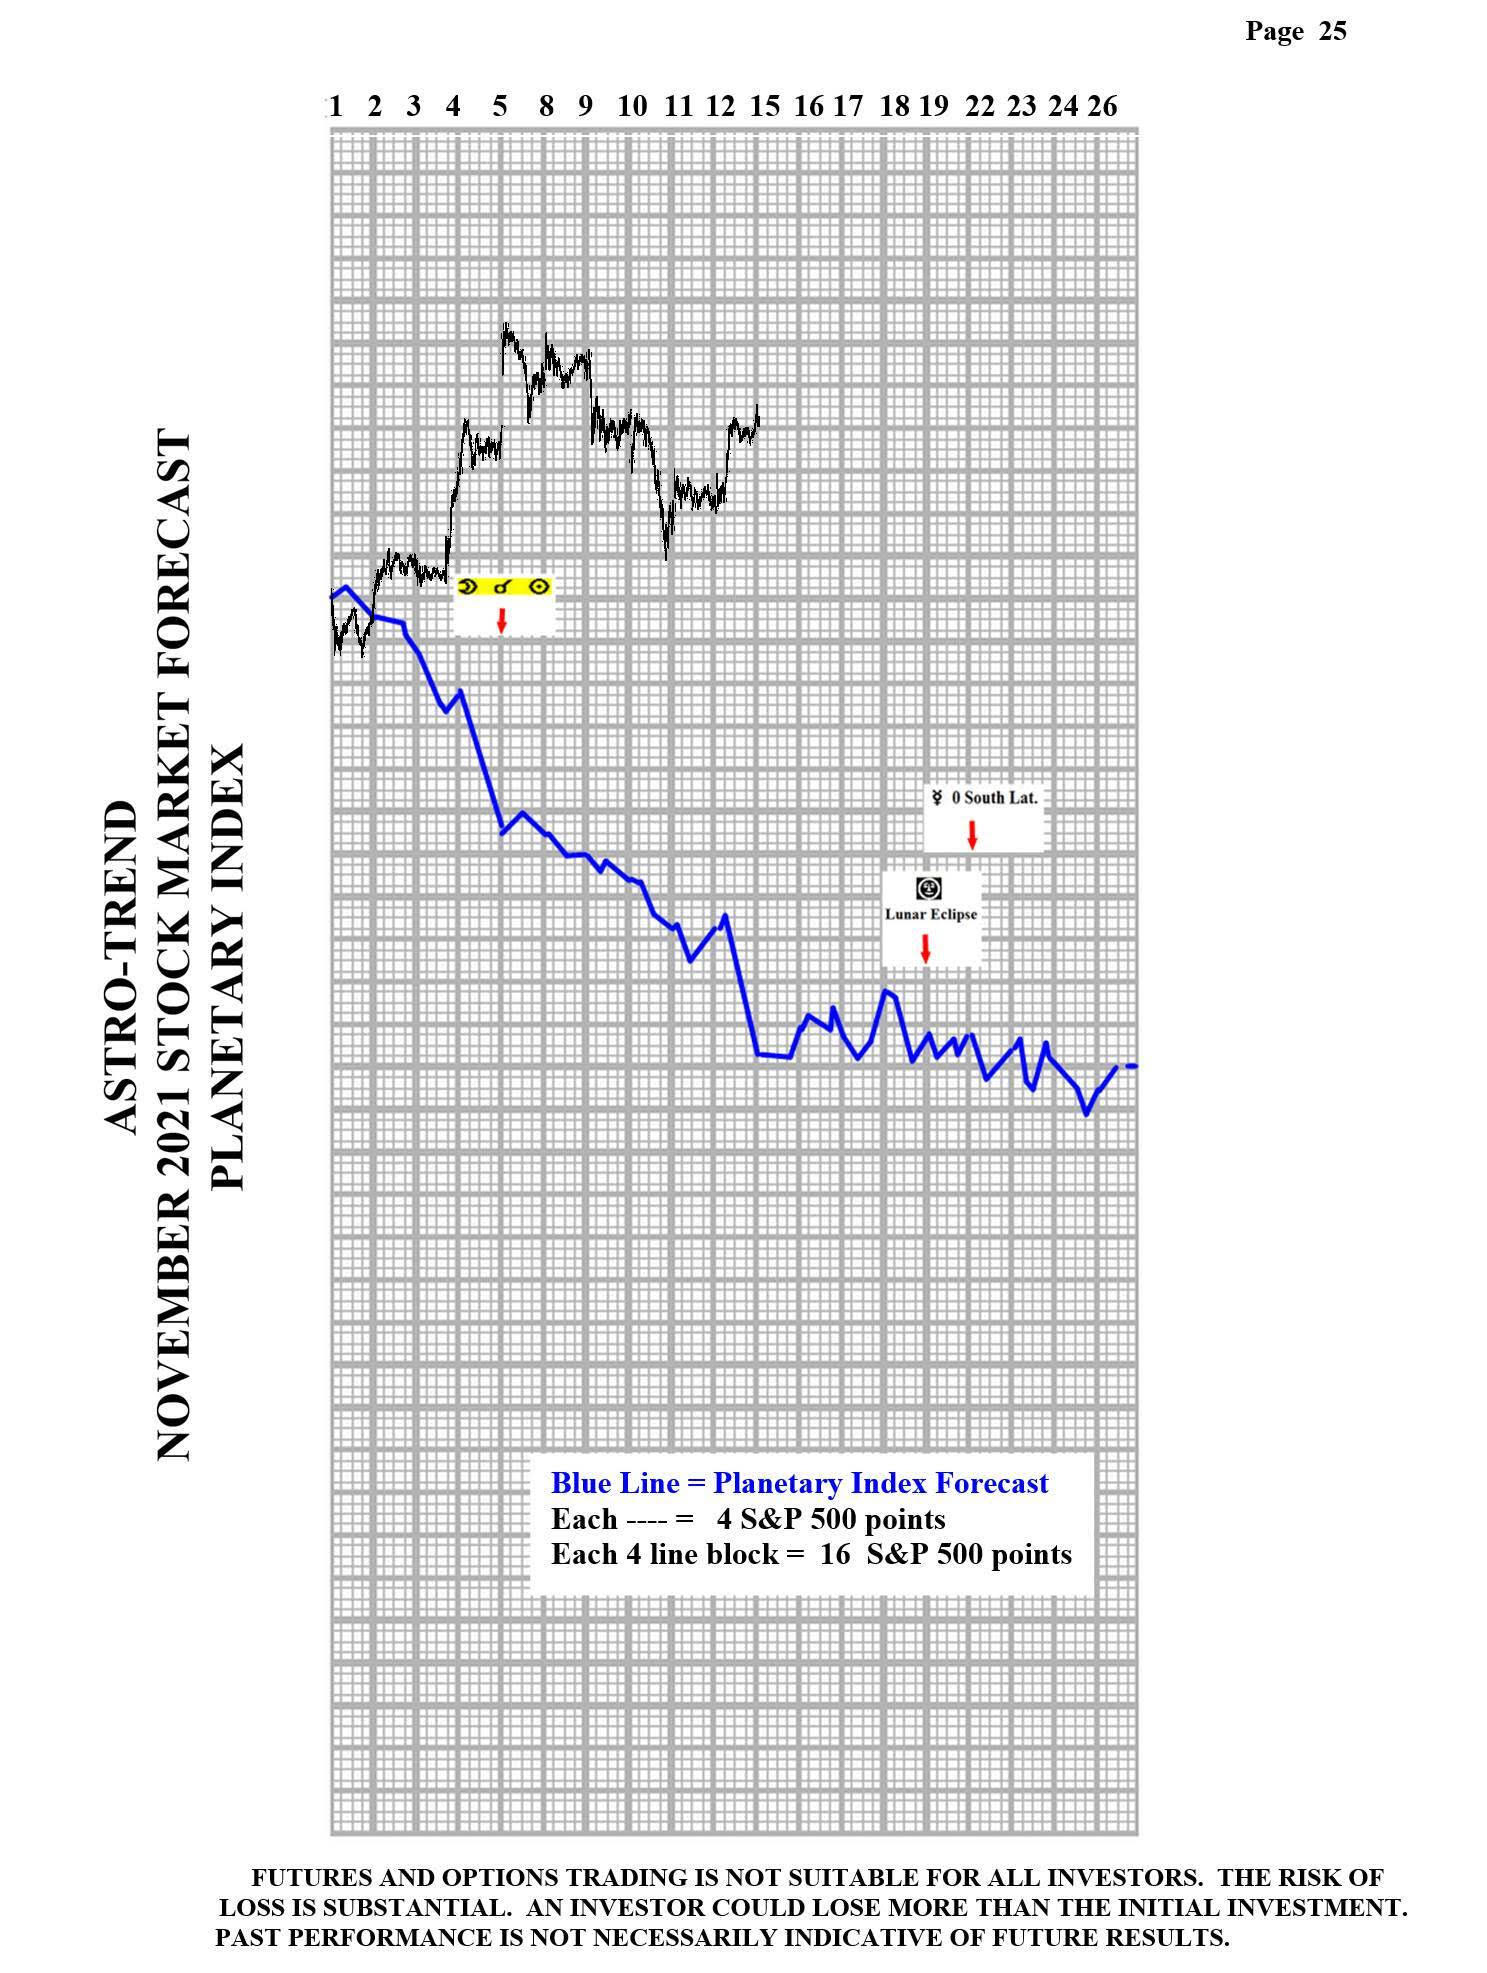
Please see below the Planetary Index charts with S&P 500 5 minute bars for results. 


Author

Norm Winski

Norm Winski

Independent Analyst

www.astro-trend.com

More from Norm Winski
Share:

Editor's Picks

EUR/USD treads water around 1.1900

EUR/USD edges a tad lower around the 1.1900 area, coming under mild pressure despite the US Dollar keeps the offered stance on turnaround Tuesday. On the US data front, December Retail Sales fell short of expectations, while the ADP four week average printed at 6.5K.

GBP/USD looks weak near 1.3670

GBP/USD trades on the back foot around the 1.3670 region on Tuesday. Cable’s modest retracement also comes in tandem with the decent decline in the Greenback. Moving forward, the US NFP and CPI data in combination with key UK releases should kee the quid under scrutiny in the next few days.

Gold the battle of wills continues with bulls not ready to give up

Gold comes under marked selling pressure on Tuesday, giving back part of its recent two day advance and threatening to challenge the key $5,000 mark per troy ounce. The yellow metal’s correction follows a better tone in the risk complex, a lower Greenback and shrinking US Treasuty yields.

AI Crypto Update: BankrCoin, Pippin surge as sector market cap steadies above $12B

The Artificial Intelligence (AI) segment is largely on the back foot with major coins such as Bittensor (TAO) and Internet Computer (ICP) extending losses amid a sticky risk-off sentiment.

Dollar drops and stocks rally: The week of reckoning for US economic data

Following a sizeable move lower in US technology Stocks last week, we have witnessed a meaningful recovery unfold. The USD Index is in a concerning position; the monthly price continues to hold the south channel support.

XRP holds $1.40 amid ETF inflows and stable derivatives market

Ripple trades under pressure, with immediate support at $1.40 holding at the time of writing on Tuesday. A recovery attempt from last week’s sell-off to $1.12 stalled at $1.54 on Friday, leading to limited price action between the current support and the resistance.