Reclaiming position north of $2,000 brewing on XAU/USD

It is no secret that the price of gold and US government bonds are correlated. Among other factors, this is due to their safe-haven appeal (according to the 60-day rolling correlation coefficient, the correlation is nearly +0.90). Consequently, gold prices are also inversely correlated with US yields and the US dollar.
With US Treasury yields facing southbound—the 10-year US Treasury yield elbowed beneath its 50-day simple moving average and is currently attempting to find grip beneath the 200-day simple moving average at 3.502%—as well as the US dollar navigating deeper waters, the XAU/USD is on the verge of closing beyond the widely watched $2,000 barrier.
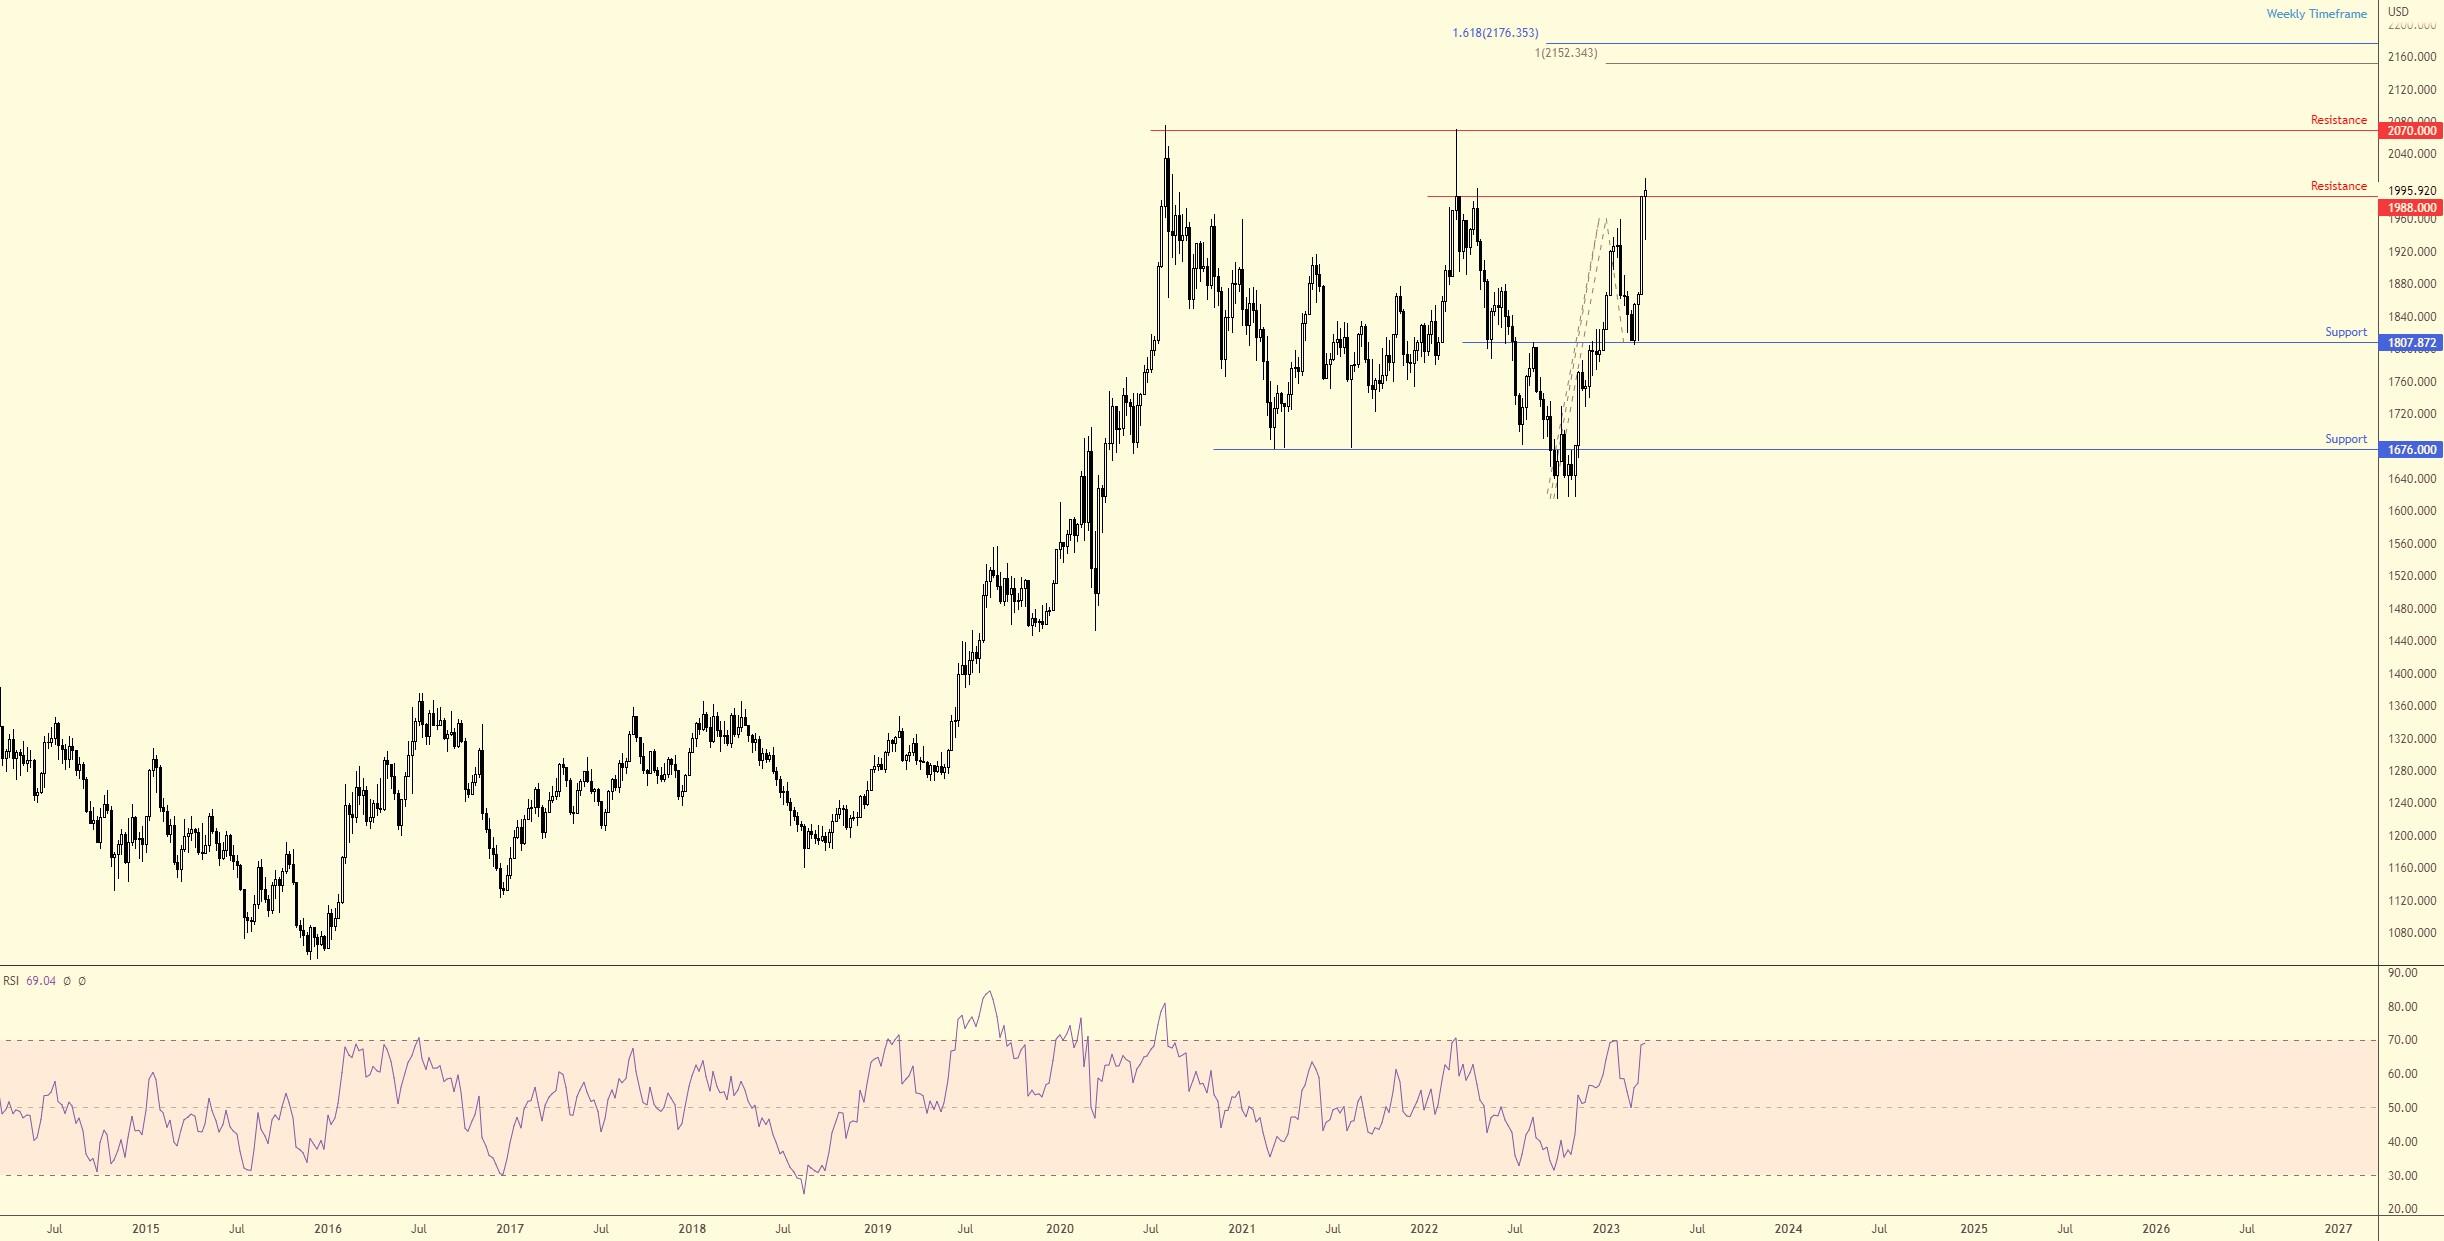
Weekly resistance from $1,988 is key
Based on the weekly timeframe, the technical landscape focuses on resistance at $1,988 in a market clearly trending higher. A moderate push north of the aforementioned barrier has been seen this week, though lacks conviction. For XAU/USD to continue climbing when the chart’s Relative Strength Index (RSI) is on the doorstep of overbought space (70.00), a decisive close above the current resistance is necessary.
Upside objectives beyond $1,988 are familiar ‘double-top’ resistance at $2,070, and a break here would call attention to the 100% projection at $2,152 that is closely shadowed by a 1.618% Fibonacci expansion at $2,176.
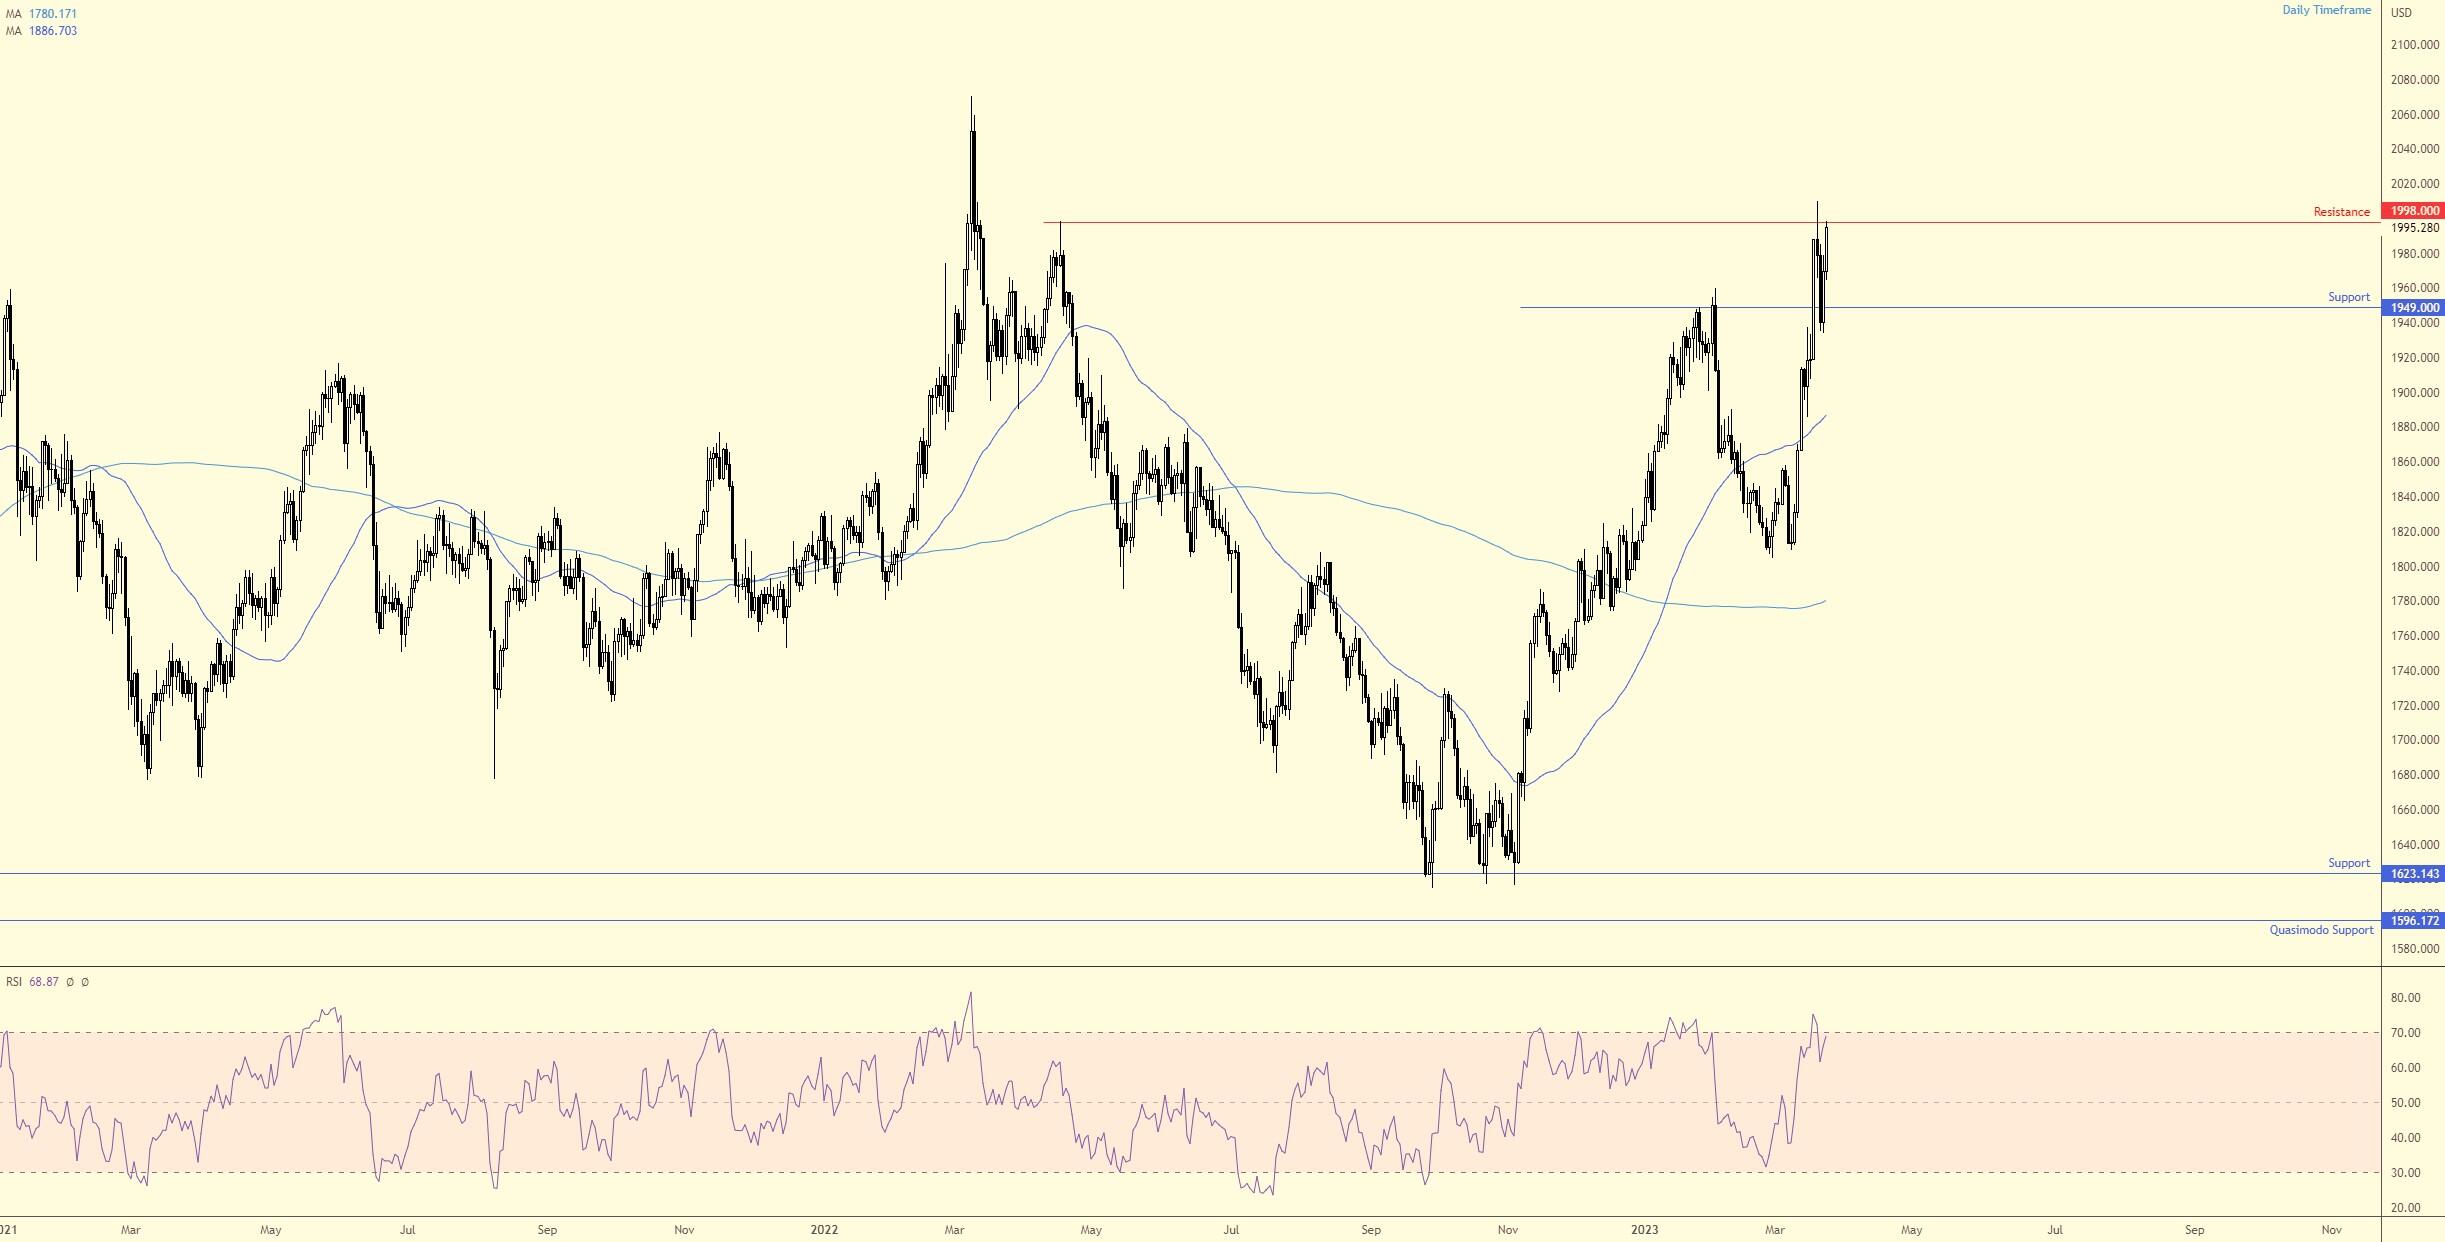
Daily timeframe: Buyers in control
Against the backdrop of the weekly timeframe, resistance-turned-support at $1,949 put in an appearance on the daily timeframe on Wednesday. In addition to the weekly scale, trend direction favours buyers on the daily, displayed not only through the 50-day simple moving average ($1,886) crossing above the 200-day simple moving average ($1,780), which is referred to as a ‘Golden Cross’, but also through price structure: a series of higher highs and lows since bottoming in late 2022 in the shape of a triple-bottom pattern.
What’s technically interesting here is that the $1,998 18 April top has already been tested and failed to generate much selling, meaning it failed to produce sufficient bearish interest to clear $1,949 support. As such, buyers are likely to overthrow $1,998 should price remain bullish north of $1,949.
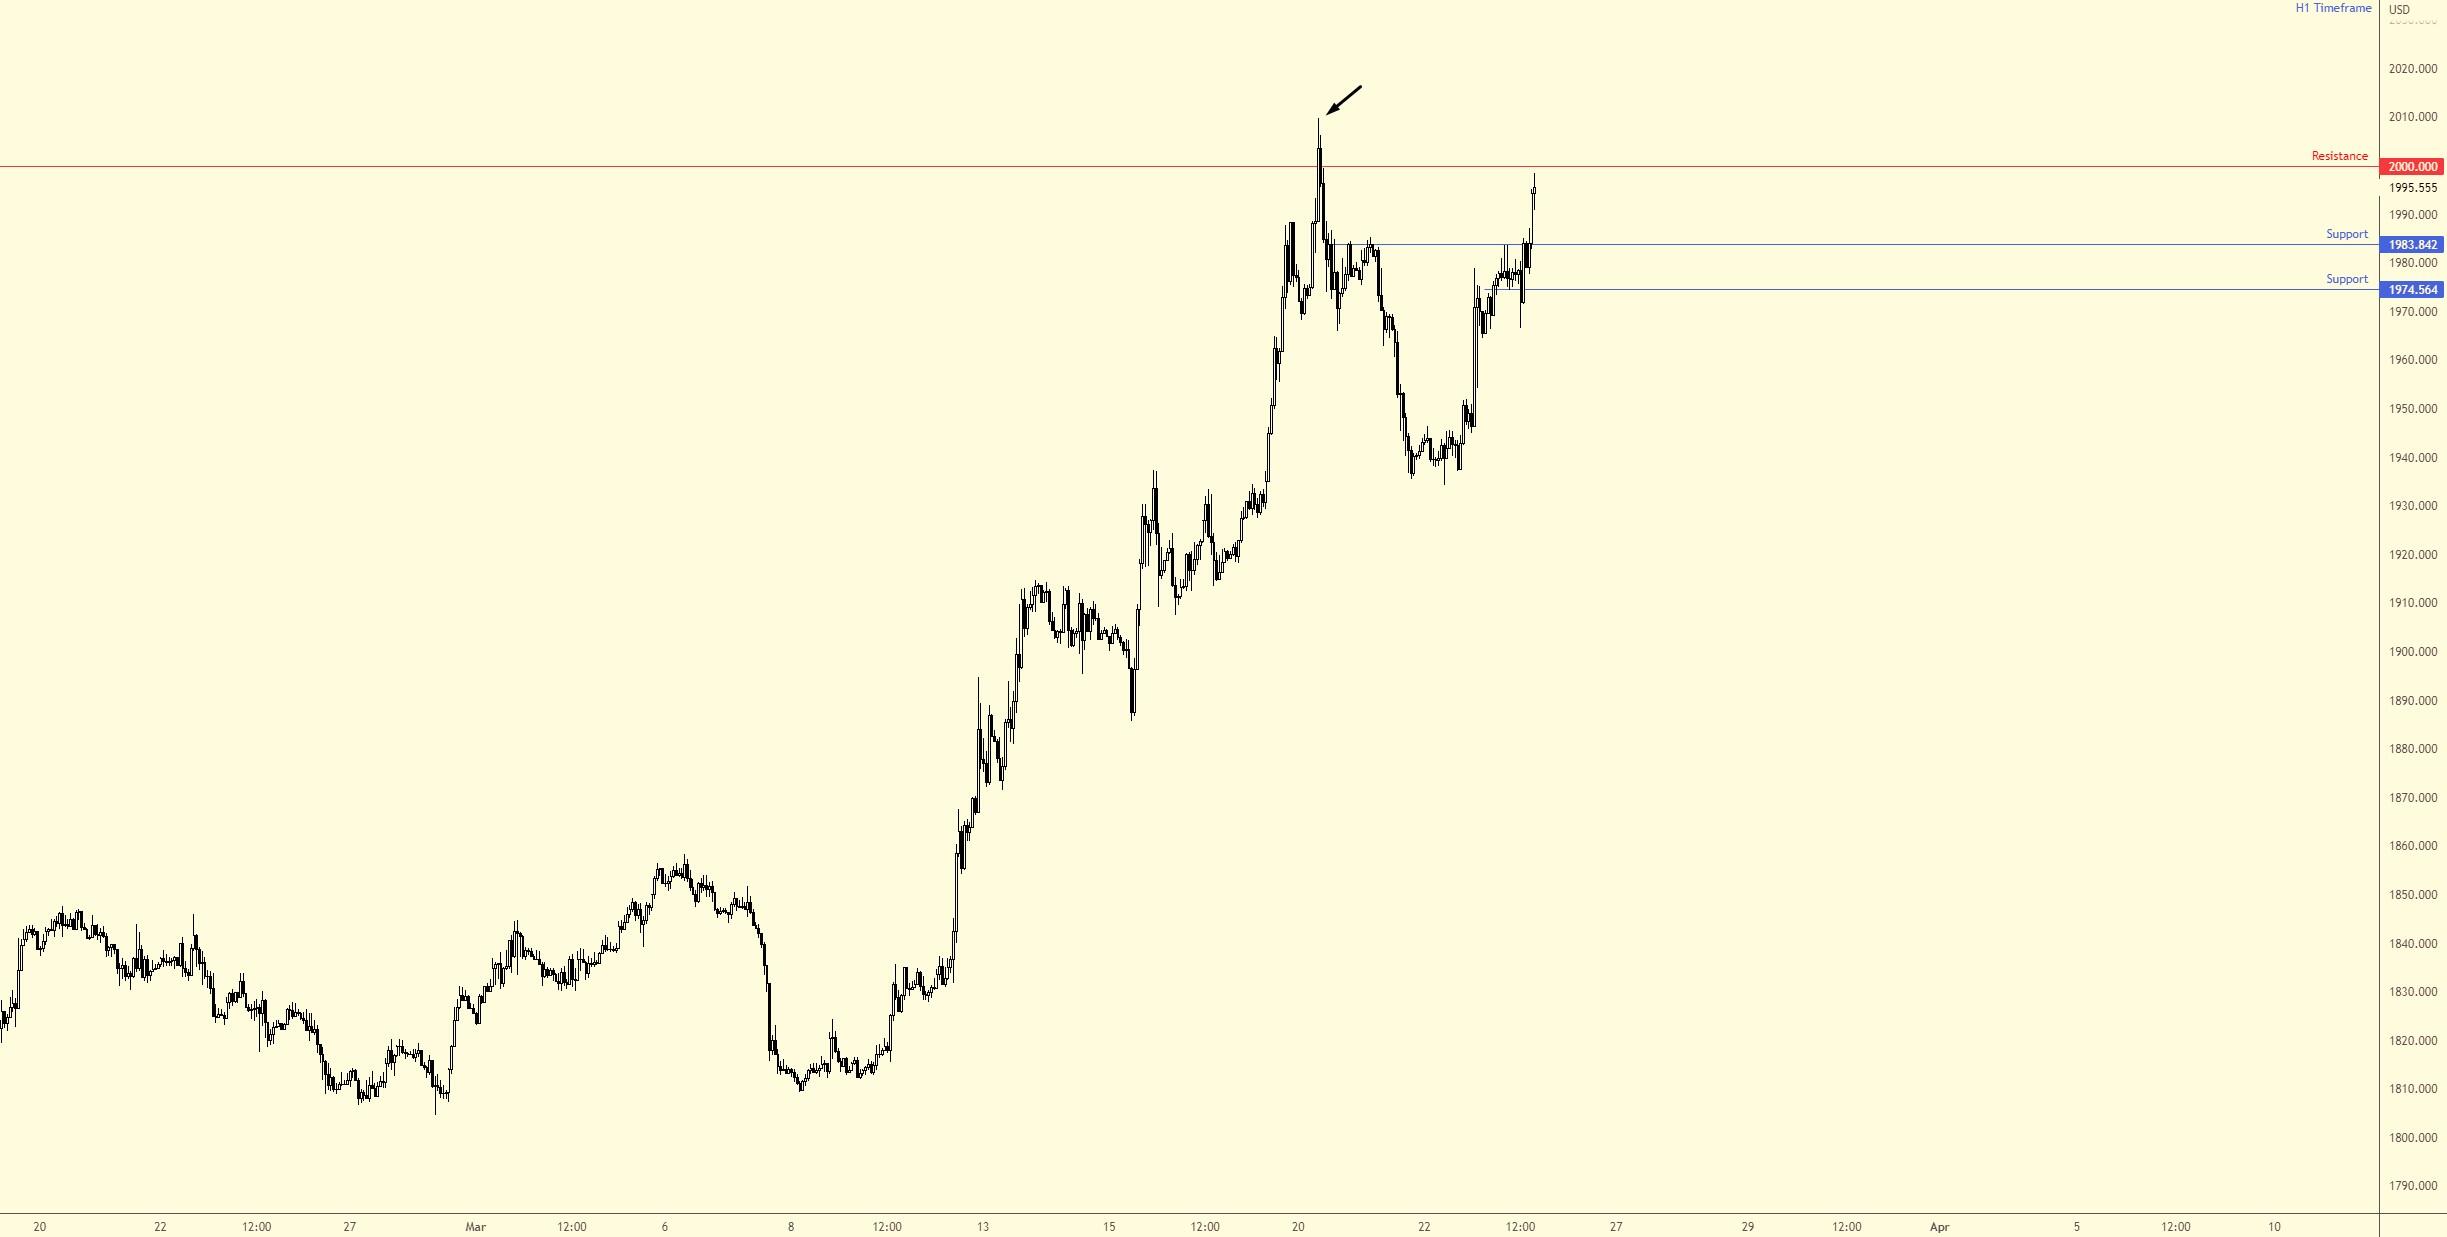
Dip buying scenario on the H1?
Shorter-term price action on the H1 chart unmasks two nearby support levels at $1,974 and $1,983; overhead, focus is on the $2,000 barrier. Knowing that $1,998 resistance on the daily scale is perhaps fragile, and the weekly timeframe working its way above resistance coming in from $1,988, a dip-buying scenario may unfold should the yellow metal pencil in a correction from current price and retest resistance-turned-support at $1,983. Alternatively, failure to retest $1,983 could see a H1 close above $2,000 take shape and ignite breakout buying interest to take things to at least the $2,009 20 March high (black arrow).
Therefore, chart studies indicate two possible scenarios. A retest of H1 support at $1,983 (or maybe even H1 support at $1,974) or a straightforward ‘no frills’ breakout above $2,000 to take on higher levels.
Author

Aaron Hill
FP Markets
After completing his Bachelor’s degree in English and Creative Writing in the UK, and subsequently spending a handful of years teaching English as a foreign language teacher around Asia, Aaron was introduced to financial trading,


