Real Estate Numbers Propel Markets

Good Morning Traders,
As of this writing 4 AM EST, here's what we see:
US Dollar: Jun. USD is Up at 98.840.
Energies: May Crude is Down at 49.35.
Financials: The June 30 year bond is Down 3 ticks and trading at 152.10.
Indices: The June S&P 500 emini ES contract is 3 ticks Lower and trading at 2384.25.
Gold: The April gold contract is trading Down at 1265.50. Gold is 17 ticks Lower than its close.
Initial Conclusion
This is not a correlated market. The dollar is Up+ and crude is Down- which is normal but the 30 year bond is trading Lower. The Financials should always correlate with the US dollar such that if the dollar is lower then bonds should follow and vice-versa. The indices are Down- and Crude is trading Down- which is not correlated. Gold is trading Down- which is correlated with the US dollar trading Up+. I tend to believe that Gold has an inverse relationship with the US Dollar as when the US Dollar is down, Gold tends to rise in value and vice-versa. Think of it as a seesaw, when one is up the other should be down. I point this out to you to make you aware that when we don't have a correlated market, it means something is wrong. As traders you need to be aware of this and proceed with your eyes wide open.
At this hour all of Asia is trading Higher. As of this writing all of Europe is trading lower.
Possible Challenges To Traders Today
– Crude Oil Inventories is out at 10:30 AM EST. This is major.
– Lack of major economic news.
Treasuries
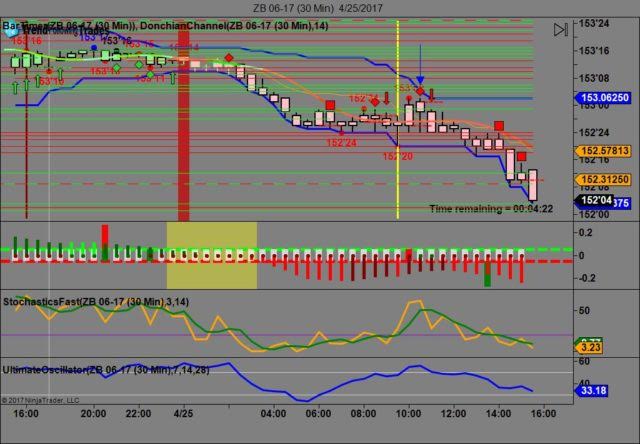
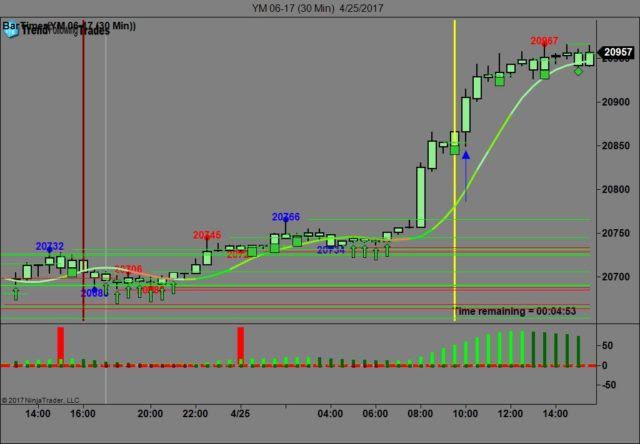
We've elected to switch gears a bit and show correlation between the 30 year bond (ZB) and The YM futures contract. The YM contract is the DJIA and the purpose is to show reverse correlation between the two instruments. Remember it's liken to a seesaw, when up goes up the other should go down and vice versa.
Yesterday the ZB made it's move at around 10 AM at around the time New Home Sales numbers were released. The ZB hit a high at around that time and the YM hit a low. If you look at the charts below ZB gave a signal at around 10 AM and the YM was moving higher at the same time. Look at the charts below and you'll see a pattern for both assets. ZB hit a high at around 10 AM and the YM hit a low. These charts represent the newest version of Trend Following Trades and I've changed the timeframe to a 30 minute chart to display better. This represented a shorting opportunity on the 30 year bond, as a trader you could have netted about 30 plus ticks per contract on this trade. Each tick is worth $31.25. We added a Donchian Channel to the charts to show the signals more clearly.
Charts Courtesy of Trend Following Trades built on a NinjaTrader platform Click on an image to enlarge it.
Bias
Yesterday we gave the markets a neutral bias as we didn't see the indices moving with any conviction yesterday morning. A neutral bias means the markets could go in any direction but in this case the markets moved higher. The Dow gained 232 points and the other indices gained ground as well. Today we aren't dealing with a correlated market and will maintain a neutral bias.
Could this change? Of Course. Remember anything can happen in a volatile market.
Commentary
So now that the French elections are over (for the time being until May 7th when the Presidential election is held); the markets turned to economic news that didn't disappoint. House Price Index and New Home Sales both exceeded expectation which in turn caused the markets to soar and they did. The Dow retook the 21,000 mark and the Nasdaq closed above 6,000, making a new record. The first time the Nasdaq hit the 5,000 mark was in March, 2000; so it took over 17 years to gain another 1,000 points. Today we are very light on eco news. We have crude oil inventories out at 10:30 AM EST but that's about it for today. We pick up steam again on Thursday when we have about 7 different economic reports.
Author

Nick Mastrandrea
Market Tea Leaves


