Quadruple Witching Doesn’t Spook Markets
Good Morning Traders,
As of this writing 4 AM EST, here’s what we see:
US Dollar: Jun. USD is Down at 99.885.
Energies: April Crude is Down at 48.98.
Financials: The June 30 year bond is Up 1 tick and trading at 148.15.
Indices: The June S&P 500 emini ES contract is 17 ticks Lower and trading at 2371.00.
Gold: The April gold contract is trading Up at 1233.80. Gold is 36 ticks Higher than its close.
Initial Conclusion
This is not a correlated market. The dollar is Down- and crude is Down- which is not normal but the 30 year bond is trading Higher. The Financials should always correlate with the US dollar such that if the dollar is lower then bonds should follow and vice-versa. The indices are Down and Crude is trading Down which is not correlated. Gold is trading Up which is correlated with the US dollar trading Down. I tend to believe that Gold has an inverse relationship with the US Dollar as when the US Dollar is down, Gold tends to rise in value and vice-versa. Think of it as a seesaw, when one is up the other should be down. I point this out to you to make you aware that when we don’t have a correlated market, it means something is wrong. As traders you need to be aware of this and proceed with your eyes wide open.
Asia traded mixed with half the exchanges higher and the other half lower. As of this writing Europe is trading mainly higher with the exception of the Milan exchange which is lower at this hour.
Possible Challenges To Traders Today
– FOMC Member Evans Speaks at 1:10 PM. This is major.
– President Trump Speaks at 7:30 PM. This is major.
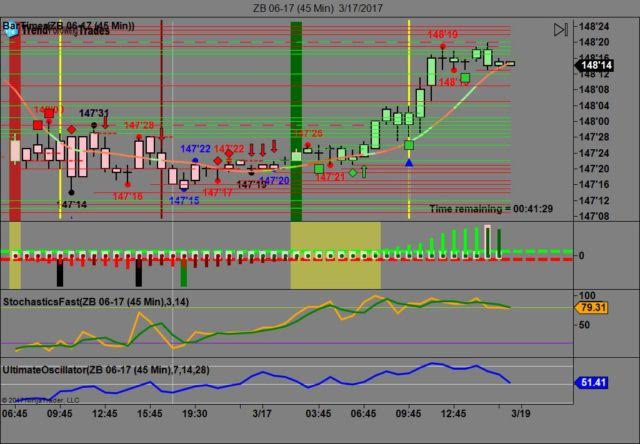
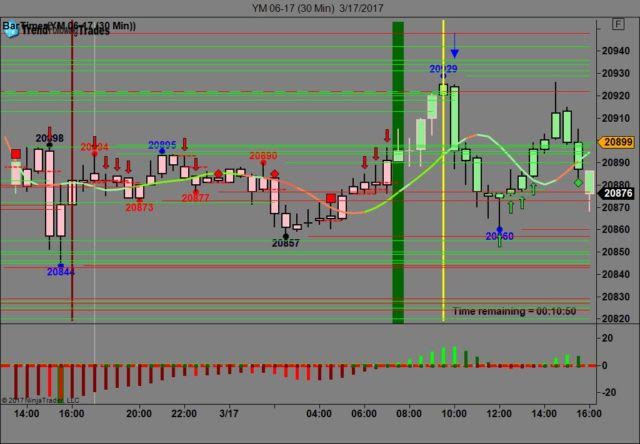
Treasuries
We’ve elected to switch gears a bit and show correlation between the 30 year bond (ZB) and The YM futures contract. The YM contract is the DJIA and the purpose is to show reverse correlation between the two instruments. Remember it’s liken to a seesaw, when up goes up the other should go down and vice versa.
Yesterday the ZB made it’s move at around 10 AM after the 10 AM economic news was reported. The ZB hit a low at around that time and the YM hit a high. If you look at the charts below ZB gave a signal at around 10 AM and the YM was moving lower at the same time. Look at the charts below and you’ll see a pattern for both assets. ZB hit a low at around 10 AM and the YM hit a high. These charts represent the newest version of Trend Following Trades and I’ve changed the timeframe to a 30 minute chart to display better. This represented a long opportunity on the 30 year bond, as a trader you could have netted about 20 plus ticks per contract on this trade. Each tick is worth $31.25. We added a Donchian Channel to the charts to show the signals more clearly.
Charts Courtesy of Trend Following Trades built on a NinjaTrader platform.
Bias
On Friday we gave the markets a neutral bias as every instrument we track was trading down. Whenever each instrument is trading either completely down or up there is no correlation, hence the neutral bias. Today we aren’t dealing with a correlated market and our bias is to the downside.
Could this change? Of Course. Remember anything can happen in a volatile market.
Commentary
On Friday we gave the markets a neutral bias and initially the markets moved up but then after 10 AM EST the markets nosedived and went up but after 2 PM EST fell into negative territory and didn’t regain parity. Quadruple Witching didn’t seem to have much of an impact on Friday’s trading. St. Patrick and President Trump did. The Dow dropped 20 points, the S&P lost 3 but the Nasdaq traded even for the day. Today we don’t have any real economic news to speak of. We have an FOMC member speaking this afternoon at around 1 PM and President Trump speaks at 7:30 PM in Louisville, Kentucky in a rally type speech. Perhaps someone should tell him he’s not campaigning anymore as he won the election but he seems to garner energy from a live crowd.
Author

Nick Mastrandrea
Market Tea Leaves


