Precious metals, lockdowns and reopening

The action in silver is really interesting. Let's check the prospects for volatile white metal, and the relevant historical analogy it offers. Is the major 2008 – 2020 analogy in terms of price moves remains intact? In short, yes.
Silver Shares Its Two Cents
Silver plunged to our initial target level and reversed shortly after doing so. It was for many months that we've been featuring the above silver chart along with the analogy to the 2008 slide. People were laughing at us when we forecasted silver below $10.
Well, the recent low of $11.64 proves that we were not out of our minds after all. Our initial target was reached, and as we had explained earlier today, the entire panic-driven plunge has only begun.
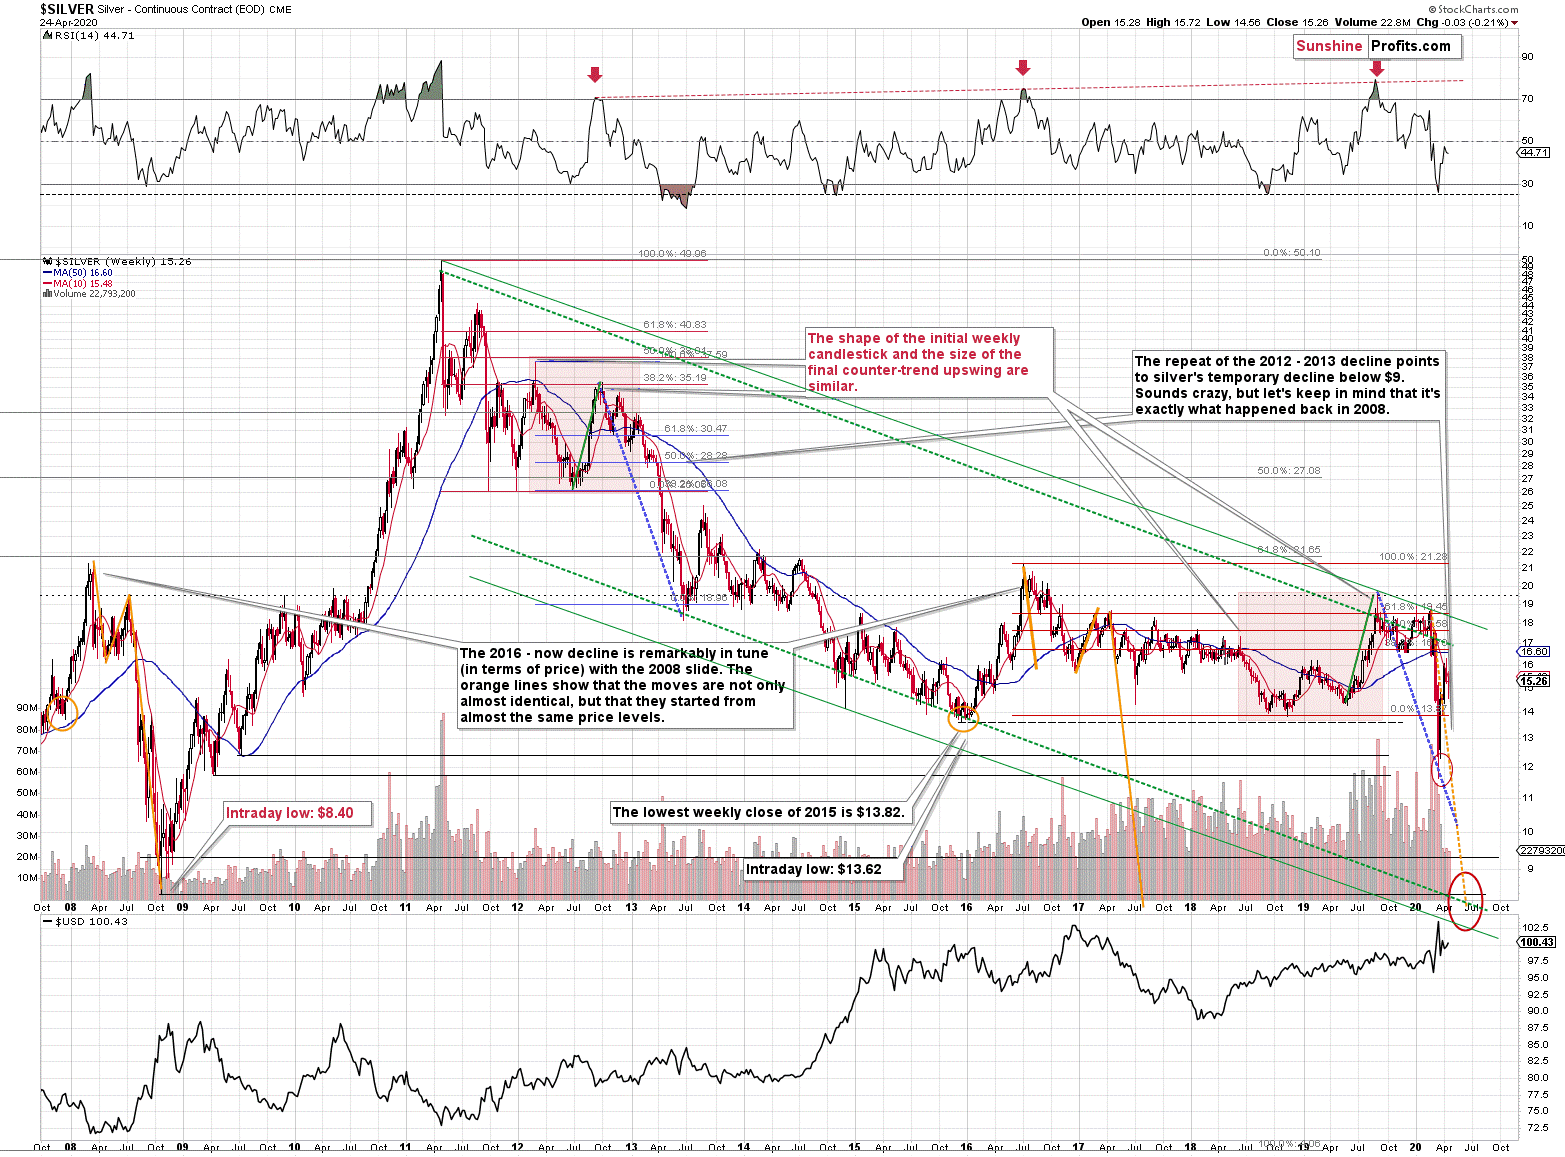
Those who were laughing the loudest will prefer not to notice that silver reversed its course at a very similar price level at which it had reversed initially in 2008. It was $12.40 back then, but silver started the decline from about 50 cent higher level, so these moves are very similar.
This means that the key analogy in silver (in addition to the situation being similar to mid-90s) remains intact.
It also means that silver is very likely to decline AT LEAST to $9. At this point we can't rule out a scenario in which silver drops even to its all-time lows around $4-$5.
Note: Silver at or slightly below $8 seems most probable at this time.
Crazy, right? Well, silver was trading at about $19 less than a month ago. These are crazy times, and crazy prices might be quite realistic after all. The worst is yet to come.
Let's quote what the 2008-now analogy is all about in case of silver.
There is no meaningful link in case of time, or shape of the price moves, but if we consider the starting and ending points of the price moves that we saw in both cases, the link becomes obvious and very important. And as we explained in the opening part of today's analysis, price patterns tend to repeat themselves to a considerable extent. Sometimes directly, and sometimes proportionately.
The rallies that led to the 2008 and 2016 tops started at about $14 and we marked them both with orange ellipses. Then both rallies ended at about $21. Then they both declined to about $16. Then they both rallied by about $3. The 2008 top was a bit higher as it started from a bit higher level. And it was from these tops (the mid-2008 top and the early 2017 top) that silver started its final decline.
In 2008, silver kept on declining until it moved below $9. Right now, silver's medium-term downtrend is still underway. If it's not clear that silver remains in a downtrend, please note that the bottoms that are analogous to bottoms that gold recently reached, are the ones from late 2011 - at about $27. Silver topped close to $20.
The white metal hasn't completed the decline below $9 yet, and at the same time it didn't move above $19 - $21, which would invalidate the analogy. This means that the decline below $10, perhaps even below $9 is still underway.
Now, some may say that back in 2008, silver rallied only to about $14 and since now it rallied to about $16, so the situation is now completely different and that the link between both years is broken. But that's simply not true.
The nominal price levels are just one of the ways that one should look at the analogy – far from being the perfect or most important one.
Please note that back in 2008, there were two smaller bottoms in silver, and this time we saw just one. The decline before the bottom was sharper, so is it really that surprising that the rebound was sharper as well? Silver ended the 2008 corrective upswing once it moved visibly above the declining orange line and that's exactly what happened recently. It also topped once it reached its 10-week moving average (red line). That's exactly what just happened.
This MA is at $15.48 and at the moment of writing these words, silver is back below it, trading at $15.35.
The situations are not perfectly identical in terms of nominal prices, but they remain remarkably similar given how different fundamental reasons are behind these price moves (in reality, what's behind both declines is fear that – itself - doesn't change).
The technique used for predicting silver price is clearer than the one that we applied for gold, so it seems useful to look not only at the USD Index for signs, but also at the white metal itself. Once silver moves to $8 or below it, it will likely serve as a strong buy sign for gold, regardless of the price at which gold will be trading at that time.
Also, please note that silver formed a big shooting star candlestick during the previous week, which is a topping sign. The volume was low, but it was not low just during the formation of this candlestick, but it's been low during this month's upswing as well. It's relatively unclear whether the volume is confirming or invalidating the shooting star. Consequently, we view it as a bearish confirmation, and we wouldn't open a position based just on it. However, since it's just one of the factors pointing to much lower silver prices in the next few weeks, we view the very bearish outlook as justified.
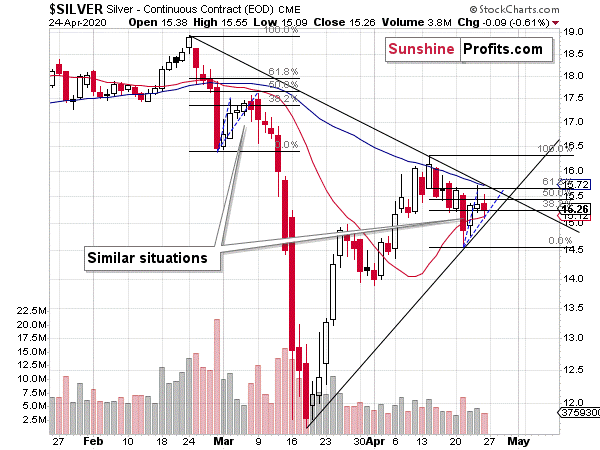
On the short-term note, we see that silver is more or less repeating its early-March performance. The price moves are not identical in terms of the Fibonacci retracement levels, but comparing the size and shape of the initial rallies (blue dashed lines) we get almost identical results. After rallying sharply initially, silver started to do... pretty much nothing. That was the same in early March. It was after a few additional days, when silver's corrective upswing had really ended, and the big slide started.
If the similarity to the early-March continues, we can expect the decline to start on Wednesday or very close to it. Please note that silver's first few days of the decline were noticeable, but not huge. However, once silver broke below its previous lows, it took only three sessions for the white metal to slide below $12. Let's keep in mind that previously silver started from higher price levels.
The implications are bearish for the following few weeks and rather neutral for the next few days.
Want free follow-ups to the above article and details not available to 99%+ investors? Sign up to our free newsletter today!
Want free follow-ups to the above article and details not available to 99%+ investors? Sign up to our free newsletter today!
Author

Przemyslaw Radomski, CFA
Gold Price Forecast
Przemyslaw Radomski, CFA (PR) is a precious metals investor and analyst who takes advantage of the emotionality on the markets, and invites you to do the same. His company, Sunshine Profits, publishes analytical software that any


