|

Pool corporation (POOL) pullback nearing completion

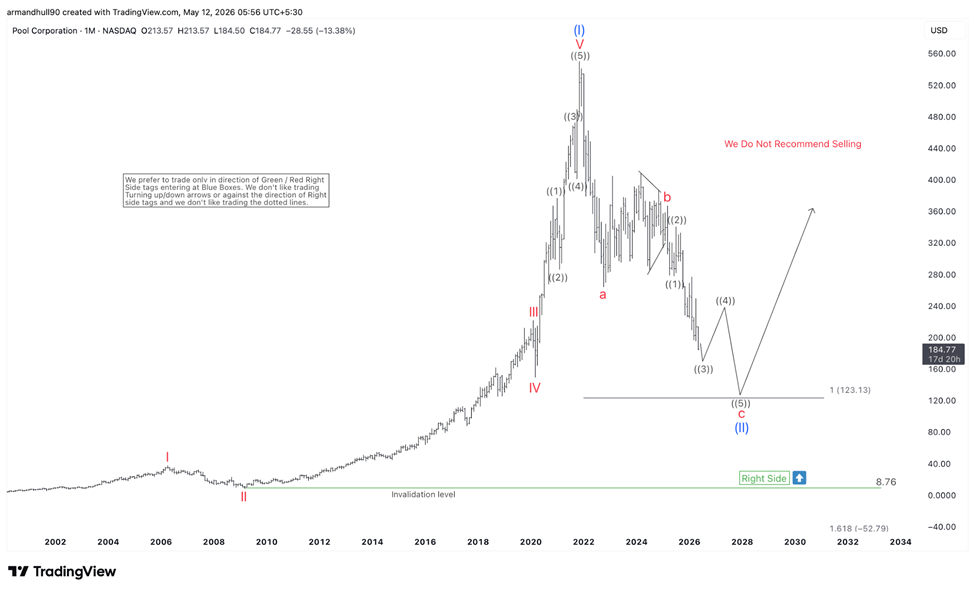
Pool Corporation (POOL) remains within a larger bullish Elliott Wave structure despite the sharp decline from its 2021 peak. The stock completed a strong impulsive rally into wave (I) after a powerful advance from the 2009 lows. This move reflected strong momentum and consistent buying pressure over several years.

After completing wave (I), POOL entered a larger corrective phase in wave (II). The decline has unfolded through a complex corrective structure and continues to pressure price lower. From the chart, the correction still appears incomplete, suggesting the stock may need one more leg lower before wave (II) fully ends. The current structure shows the market progressing through the later stages of the correction. Price has already delivered a substantial decline from the highs, but the Elliott Wave sequence still favors additional downside before a durable bottom forms.
Chart

POOL Wave (II) support zone and wave (III) outlook

Based on the projected structure, wave (II) may extend toward the 123 region before finding stronger support. This level aligns with a key Fibonacci projection and marks an important technical area where buyers could return. The chart also suggests the decline may complete a larger five-wave sequence before the correction finishes.

In the short term, the market may continue to experience volatility and downside swings. However, once wave (II) completes near the projected support zone, the stock should begin a new bullish cycle in wave (III). Third waves often represent the strongest phase within an Elliott Wave structure and usually generate sustained upside momentum.

The long-term bullish trend remains valid as long as the broader structure holds above the major invalidation level near 8.76.

Summary

Pool Corporation continues to correct within wave (II) after completing a major bullish cycle in wave (I). The decline may extend toward the 123 area before wave (II) completes. Once the correction ends, a strong bullish recovery in wave (III) should begin and support renewed upside over the long term.

Author

Elliott Wave Forecast Team

Elliott Wave Forecast Team

ElliottWave-Forecast.com

More from Elliott Wave Forecast Team
Share:

Editor's Picks

AUD/USD flirts with 0.7000, lowest since early August amid bullish USD

AUD/USD hits a fresh low since early August during the Asian session on Friday and looks vulnerable near 0.7000 after breaking below the 200-day SMA overnight. Against the backdrop of the hawkish Fed, a two-day rally in oil prices revives inflation fears and continues to push US bond yields to multi-year highs. Adding to this, geopolitical risks lift the US Dollar to a two-month high, overshadowing RBA rate hike bets and weighing on the pair.

USD/JPY pulls back from three-week high after failing near 159.00

USD/JPY edges lower during the Asian session on Friday, stalling its recent strong move to a three-week high of 159.00 as Japanese Yen bears turn cautious amid intervention fears. Meanwhile, the US Dollar retains a strong bullish undertone as the Fed's hawkish outlook and oil-driven inflation fears continue to push US bond yields to multi-year peaks. Furthermore, the BoJ's dovish rate hike last week might cap JPY and support spot prices.

Gold treads water below $4,300

Gold grabs some buying attention and advances marginally at the end of the week, partially retracing the weekly decline, although it is still navigating below the key $4,300 mark per troy ounce. The fresh selling bias on the Greenback and the modest decline in US Treasury yields appear to support the humble advance in the precious metal.

Crypto Today: Bitcoin and Ethereum edge lower, XRP extends recovery as macro headwinds weigh

The broader cryptocurrency market is consolidating on Friday, with Bitcoin paring losses slightly above $84,000. Ethereum declines in tandem with BTC. Ripple (XRP), meanwhile, paints a different picture.


Fed vs BoJ: Both hiked. The market only believes one of them – and the chart shows which
The Federal Reserve (Fed) and the Bank of Japan (BoJ) have just done something remarkably similar. Both central banks raised interest rates by 25 basis points (bps) last week, both are confronting inflation risks, and both signal that future decisions will depend on incoming economic data.
Fed vs BoJ: Both hiked. The market only believes one of them – and the chart shows which

The Fed and the BoJ have just done something remarkably similar. Both central banks raised interest rates by 25 bps last week, both are confronting inflation risks, and both signal that future decisions will depend on incoming economic data.














