-0.4%: Why the biggest CPI drop since 2020 couldn't buy back a single cut

The June Consumer Price Index (CPI) fell 0.4% on the month, the largest one-month decline since April 2020, dragging the annual rate to 3.5% from May's 4.2% and snapping a three-month acceleration streak. Core prices went nowhere, flat on the month and down to 2.6% YoY, both under consensus. Against expectations of -0.1% and 3.8%, the miss was three-tenths on the month and three on the year, and the rates market’s answer was to soften its stance around the edges but keep pricing hikes.
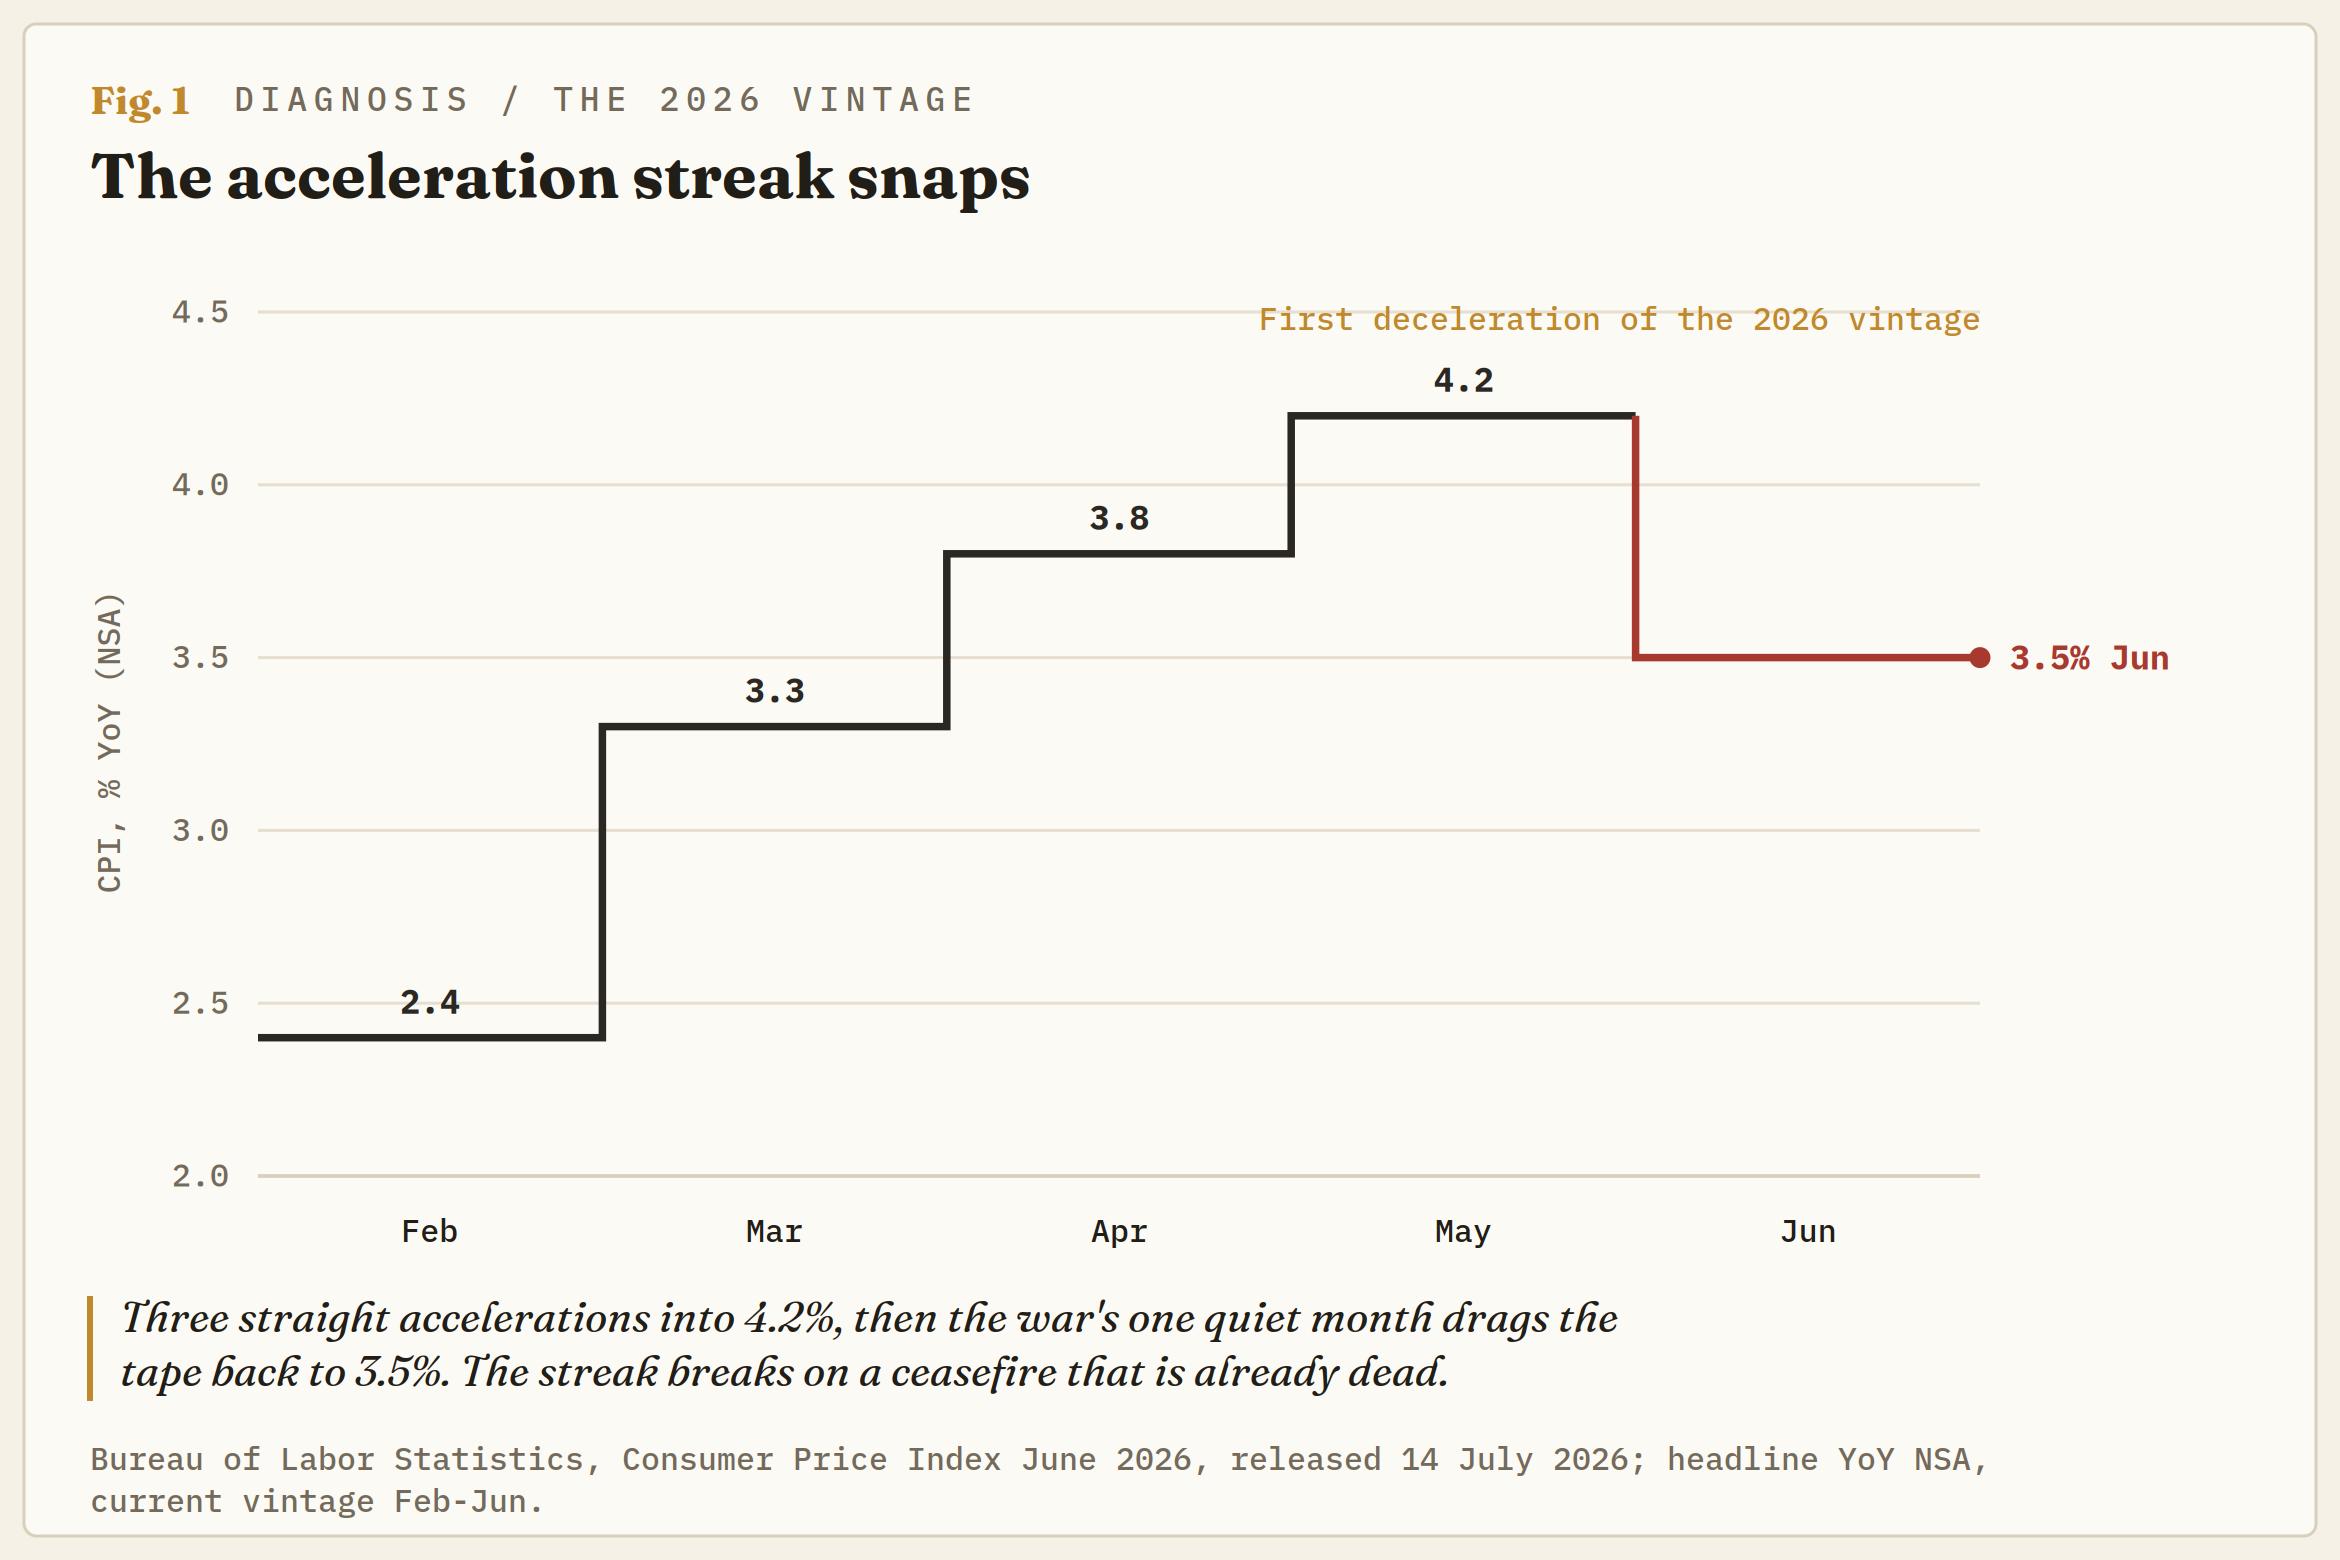
The market is not being stubborn. It is reading the timestamp. June was the one month of 2026 in which the war went quiet, and by the time the Bureau of Labor Statistics (BLS) developed the photograph, the ceasefire it captured had already died.
A photograph developed too late
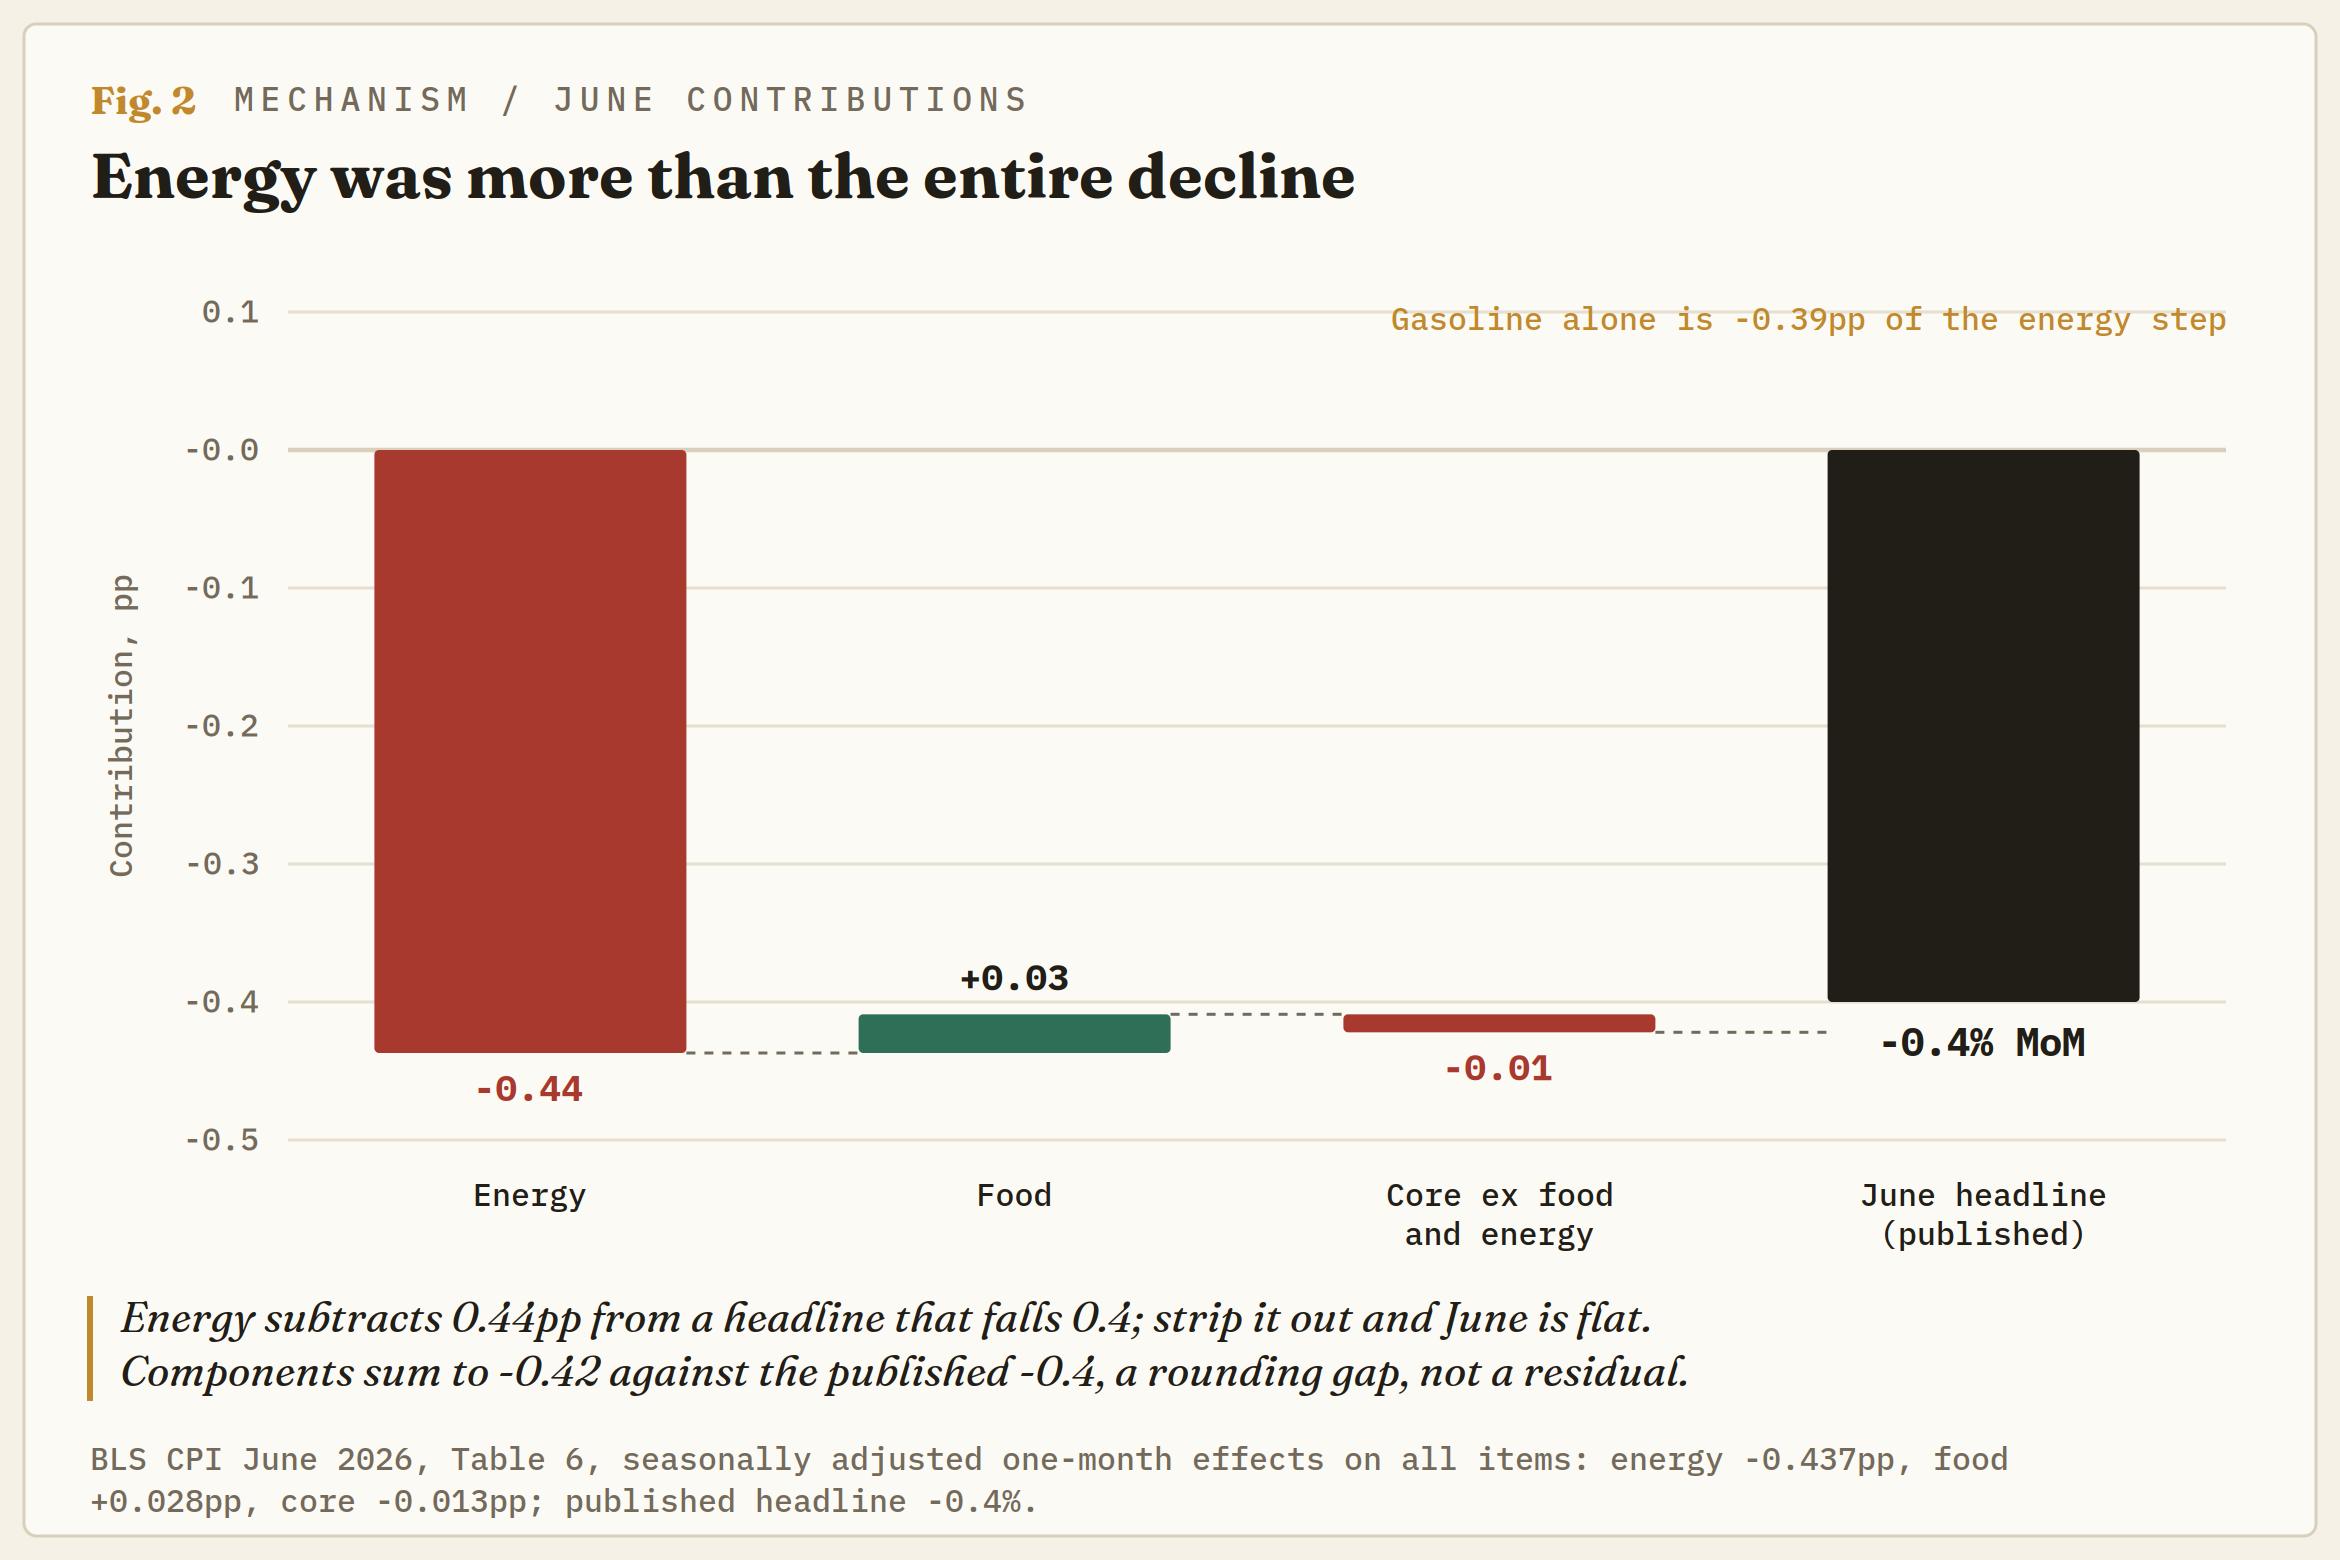
Energy did all of it, and then some. The energy index fell 5.7% in June, its steepest month since April 2020, with gasoline down 9.7%, the largest drop since August 2022. The contribution math ends the argument before core even enters: energy subtracted 0.44 percentage points from a headline that fell 0.4. Strip energy out, and the index was flat on the month.
June earned that plunge honestly. Brent spent the month unwinding its war premium, from above $100 at the conflict peak to around $78 by mid-June, roughly 40% off the highs, as the interim deal firmed and Hormuz flows partially resumed. Pump prices chased crude lower for four straight weeks, which is why consensus was already negative; forecasters had the direction and missed the size.
The trouble is the reference period. The ceasefire broke for a third time starting on July 8 as tanker traffic through the Strait of Hormuz essentially stopped, and Iranian crude sanctions were reimposed. Brent jumped nearly 9% intraday back through $80. Crude now sits roughly 10% above where June's survey window left it, gasoline is still up 26.7% YoY even after the plunge, and the July CPI, due 12 August, photographs the reversal. Whatever this print says about the trend, it says it about a month that no longer exists.
An autopsy of zero
The core at zero is the genuine puzzle, because it is not Oil. It is also not one story. The flat month decomposes into three piles that deserve very different treatment.
The first pile is real cooling. Shelter rose 0.1%, its smallest monthly increase since January 2021, with rent up 0.1% and owners' equivalent rent up 0.2%. At roughly 35% of the basket, this is the one piece of June with nothing to do with Hormuz, and the one piece most likely to persist.
The second pile is the war working through demand. Hotel rates fell 2.8%, jewellery printed its worst month on record, and airline fares stalled to +0.2% after months of war-tax gains that still leave them 26.5% higher YoY. May’s CPI print argued households were absorbing the gasoline tax by cutting discretionary spending, demand destruction wearing a disinflation costume. June is that thesis with a stamp on it. The index excluding food and shelter fell 1%, its biggest drop since April 2020.
The third pile is administered one-offs. Motor vehicle insurance fell 2% after 1.7% in May, the softest print since October 2020, and wireless plans dropped 3.3% as carriers reprice. These are events, not trends; insurers and phone carriers do not cut every month. A zero assembled from record and multi-year lows across four line items at once is fragile arithmetic, not a regime. And not everything cooled: Haircuts posted their hottest month since November 2022, and car rental jumped 5.1%.
The shelf disagrees with the pump
Food rose 0.2% and looks tame until you read the composition. Beef is running 11.8% higher YoY, ground beef 12.4% YoY, and the monthly pace reaccelerated in June after a pause in May. Cheese rose 2.8% on the month, its hottest print since August 2007, eggs jumped 4.3%, milk rose 2%, and food at home posted its firmest month since April. The produce aisle and the coffee shelf fell, while the protein and dairy case did not.
That split is the fertiliser and feed bill arriving on schedule. The Gulf supplies roughly half the world's urea, which ran up some 80% off its lows when Hormuz choked the feedstock complex, and farm inputs reach the shelf on a planting-to-harvest clock rather than a trading screen.
The staff forecast in the June Federal Open Market Committee (FOMC) Minutes lifted inflation for both 2026 and 2027 on precisely this channel, and the June Summary of Economic Projections (SEP) or dot plot already carries an year-end 2026 forecast for the Personal Consumption Expenditures Price Index (PCE) of 3.6%, up from 2.7% in March. The pump deflated in June. The shelf is quietly doing the opposite, and the shelf is where energy shocks go to become core. The pump remains the wrong tell.
The strip kept its hikes
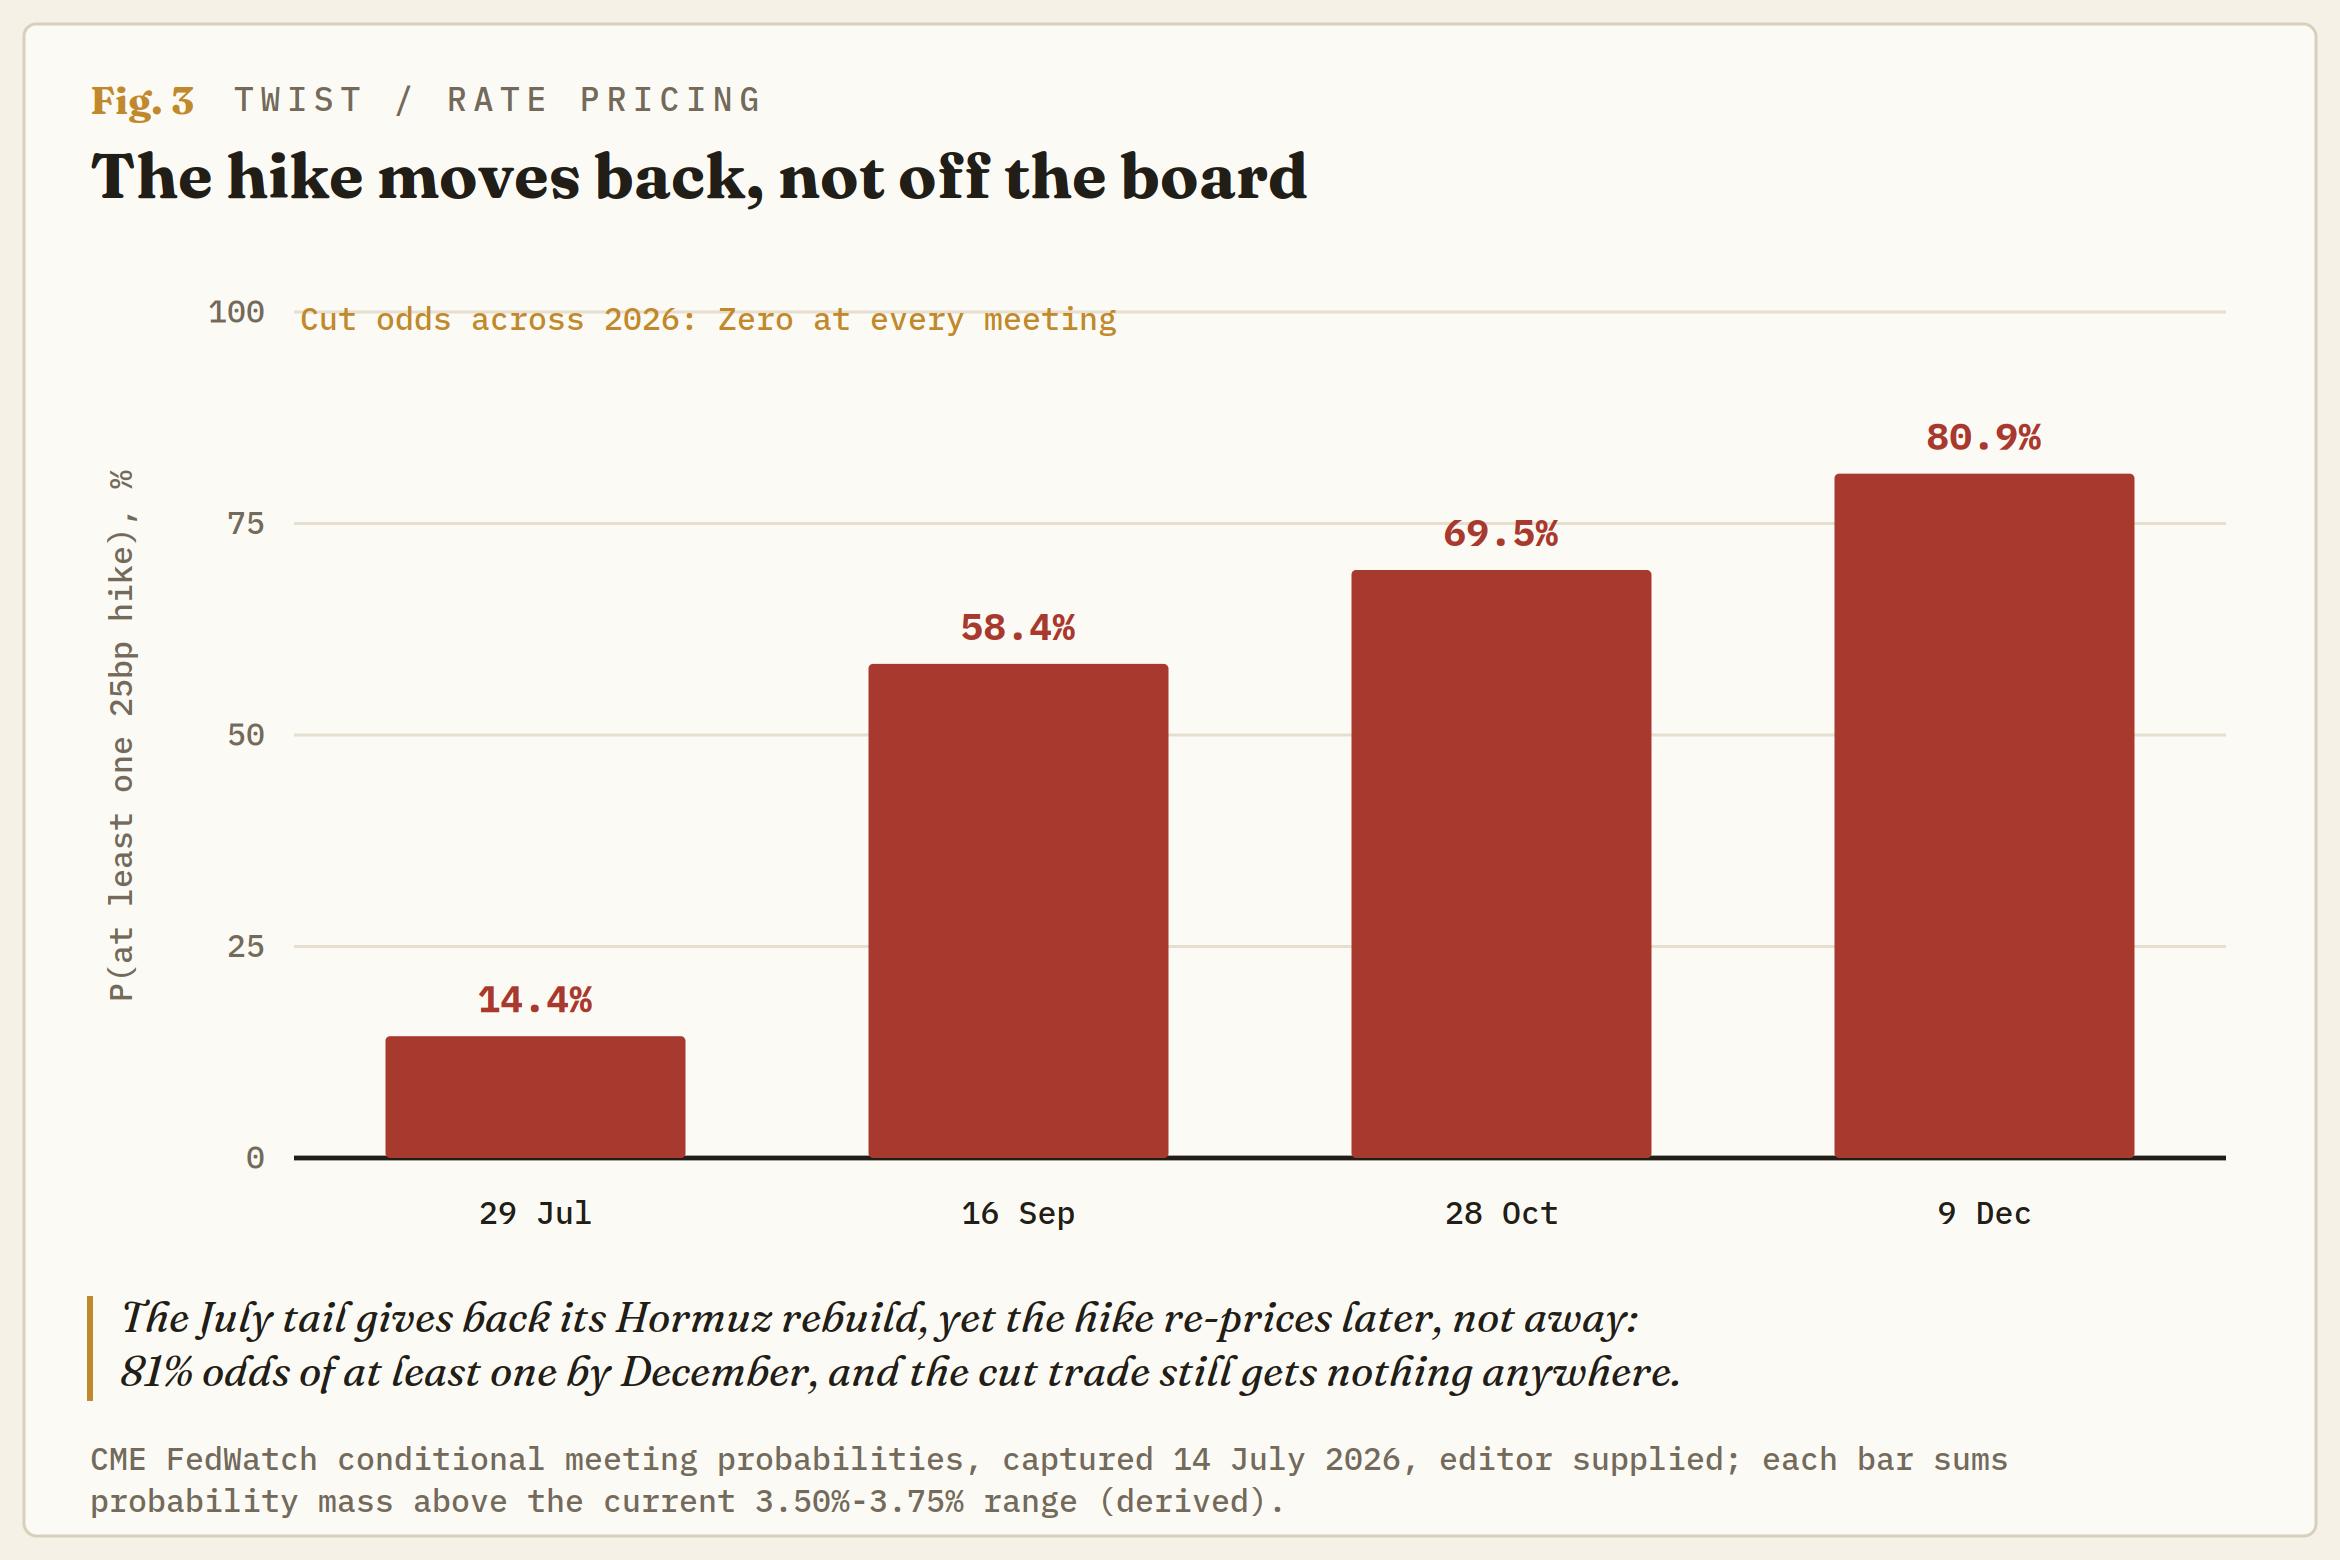
The market repriced in one session, and the shape of the repricing is the story. CME FedWatch now has the 28-29 July meeting at an 86% hold of the 3.50%-3.75% range against a 14% hike. That tail ran from 10% in early June to a 40% late-June peak, faded to 20% on the soft jobs print, rebuilt above 30% on the Hormuz re-closure, and gave most of that rebuild back on this print.
The print pushed the hike back, not off the board. By the 16 September meeting, a single hike is still the modal outcome at 51%, with the odds of at least one at 58%. By October, the cumulative figure is nearly 70%, and by December it is 81%, with one hike now clearly ahead of two at 42% against 30%. The probability of a 2026 cut after the largest monthly price decline in six years: zero at every meeting on the board.
Read that as the no-guidance regime doing what it was built to do. There is no chair's dot to anchor against, the July meeting carries no SEP, and the CPI series itself still has a hole where October and November 2025 should be, so the strip prices the conditional instead.
The June Minutes were explicit that the disinflation base case rested on Hormuz disruptions diminishing, and that conditional inverted before this number printed. Federal Reserve (Fed) Chair Kevin Warsh has said plainly he is not comfortable with inflation above 2%; the headline just handed him 3.5% and a reason to believe the next one runs higher. A deflation print was a gift to the cut camp in the White House; it bought a thinner July tail and not one basis point of 2026 easing.
Three dates and a conditional
The framework from here is a calendar. Wednesday's June Producer Price Index (PPI) release will test whether the pipeline deflated with the pump or kept passing the feedstock bill. May's ran 6.5% YoY with wholesale margins absorbing the war tax, so a soft headline over a firm core would extend June's pattern upstream.
The 28-29 July FOMC brings a statement the committee has already cut to roughly 130 words and no projections, leaving the July hike tail near 14% as the cleanest real-time read on whether the war premium re-arms it into the meeting. And August 12 delivers July CPI, collected with crude 10% higher and Hormuz shut.
The lean: Treat June as the trough of the vintage, not the trend. A flat July would hold the annual rate near 3.5%; a war-premium July would push it back toward 4%. Traders positioned for the easier-inflation trade to extend are long a photograph. The decline was real, the month it describes is over, and the grocery aisle says the next leg of this shock does not travel through the pump at all.
Author

Joshua Gibson
FXStreet
Joshua joins the FXStreet team as an Economics and Finance double major from Vancouver Island University with twelve years' experience as an independent trader focusing on technical analysis.