Personal Income, Spending and Prices June Preview: After all the agony just an average quarter?
- Personal income expected to slip in June, personal spending to rise.
- Spending in the second quarter to be just below the 2019 average, retail sales were double those of last year.
- Income declined in June as people returned to work mirroring average hourly earnings.
- Market impact will limited after Thursday’s Q2 GDP data.

The last major consumption figure for the second quarter is slated to show a substantial gain in June with spending for the period just slightly below the average for last year.
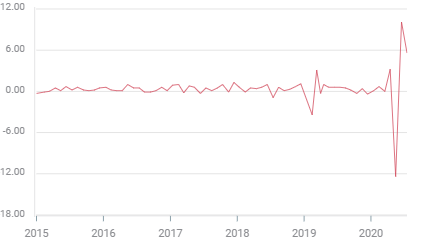
Personal spending is forecast to increase 5.5% following May’s 8.2% gain. This measure of consumption fell 12.6% in April and 6.9% in March.
Personal spending

Personal income is projected to drop 0.5% last month following a 4.2% decline in May and a 10.8% rise in April.
The personal consumption expenditure price index (PCE) is expected be flat on the month in June and 0.5% higher on the year. The core monthly index will be 0.2% higher with the annual figure at 1.0%
Personal spending and retail sales
This category of consumption, properly personal consumption expenditures (PCE) is a broader grouping than retail sales that includes services and is tracked from the household purchase side rather than the vendor.
If the June prediction is accurate personal spending would have averaged a 0.37% increase per month in the second quarter with the April drop of 12.6% more than replaced by the May and June gains (8.2% and 5.5%). Surprisingly, that is hardly different than the 0.39% monthly average in 2019.
The pattern is similar to the retail sales control group which averaged a 1.1% monthly gain in the second quarter (June 5.6%, May 10.1%, April-12.4%) more than double the 2019 monthly average of 0.5%.
Retail sales control group
Personal income
The personal income data has been skewed by the departure and then partial return of lower paid workers in the pandemic layoffs.
As hourly workers were laid off in April in large numbers income appeared to rise 10.8% as it recorded the change to a better compensated pool of employees. The reverse happened in May as the return of lower paid furloughed workers decreased the overall average.
These figures from the Bureau of Economic Analysis, a division of the Commerce Department, like the personal spending data above, track a wider set of criteria than the average hourly earnings numbers from the Bureau of Labor Statistics, by including, pensions, unemployment benefits, interest, dividends and all manner of transfer payments.
Average hourly earnings exhibited the same alteration and for the same reason. Earnings rose 4.7% in April as lower paid workers left and fell 1.0% in May and 1.2% in June as they were rehired.
PCE price index
Prices have registered the profound decline in demand in March and April as the economic closures took hold in March and April.
Overall prices fell 0.2% in March and 0.5% in April then rose 0.1% in May and are expected to be flat in June. Annual numbers were the same, falling from 1.8% in February to 1.3% in March, 0.6% in April and 0.5% in May where they are predicted to remain.
The core PCE price index, the well-known bridesmaid of Fed inflation policy, dropped 0.1% in March, 0.4% in April and rose 0.1% in May. Annual numbers were 1.7% in March, and 1% in April and May.
Core PCE price index
The primary cause of the temporary deflation was price discounting by retailers as they attempted to move merchandise and goods whose sales were frozen by the instantaneous collapse of purchasing in the lockdowns.
The Fed’s current focus is economic support and employment and these inflation figures will not even be an afterthought in bank policy.
Conclusion and markets
Consumption data for the second quarter has shown an unexpected resilience. Retail sales doubled its 2019 average and the wider measure of personal spending may be just a fraction below last year’s average. Neither would seem to foretell the extreme collapse in GDP predicted by most economic models.
At about 70% of economic activity consumer spending dominates GDP. Of the balance in the Bureau of Economic Analysis’s accounting business investment dropped precipitously in the second quarter and net exports probably did also. Government spending, to put it mildly, went through the roof.
Markets have priced in an extreme drop in American GDP in the second quarter.
Though these spending and income figures will be released on Friday after the GDP numbers they may be at odds with the expected economic activity in the Covid quarter.
Premium
You have reached your limit of 3 free articles for this month.
Start your subscription and get access to all our original articles.
Author

Joseph Trevisani
FXStreet
Joseph Trevisani began his thirty-year career in the financial markets at Credit Suisse in New York and Singapore where he worked for 12 years as an interbank currency trader and trading desk manager.


