Patterns: ZAR/JPY, CAD/JPY, GBP/CAD, GBP/AUD
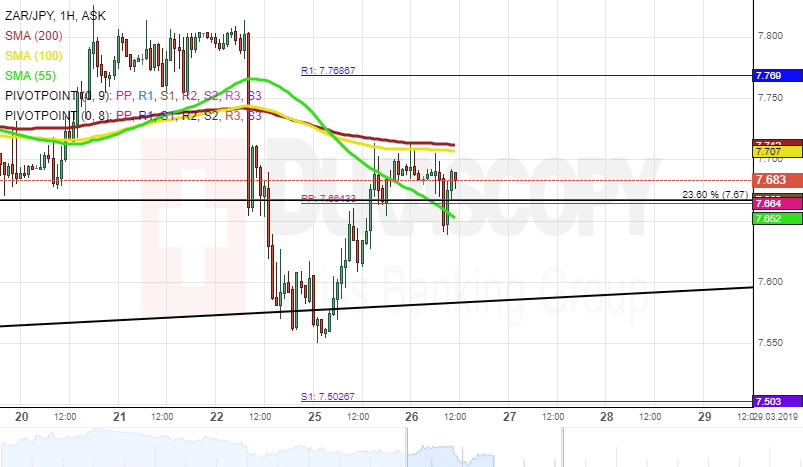
ZAR/JPY 1H Chart: Pressured by 100– and 200-hour SMAs
The ZAR/JPY exchange rate reversed south from the resistance level formed by the Fibonacci 50.00% retracement and reached the lower boundary of the long-term ascending channel at 7.58.
Currently, the currency pair is testing the resistance level formed by a combination of the 100– and 200-hour SMAs at 7.71. If given resistance does not hold, it is likely that some upside potential prevails in the market.
Otherwise, it is likely that the rate re-tests the lower channel line. If given trend does not hold, it is expected that a breakout south occurs within the following sessions. Potential downside target is the psychological level at 7.20.
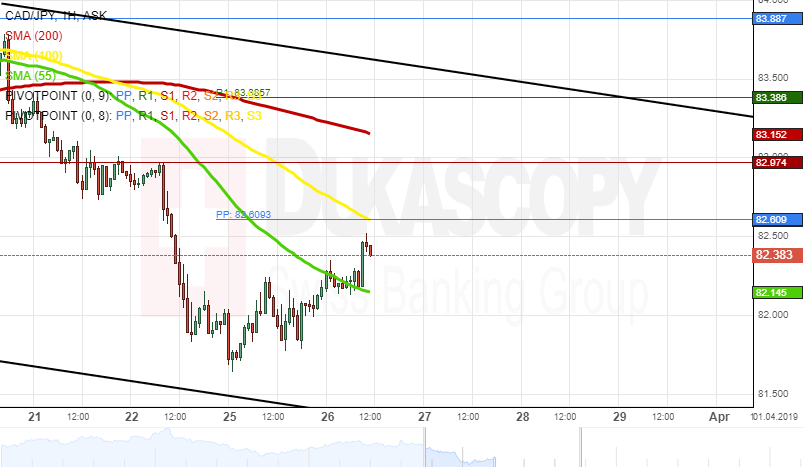
CAD/JPY 1H Chart: Short-term channel in sight
The Canadian Dollar has been depreciating against the Japanese Yen since the beginning of March. This movement has been bounded in the descending channel.
As apparent on the chart, the CAD/JPY currency pair has already reversed north. From a theoretical perspective, the exchange rate should reach the upper channel line located circa 83.50 in the nearest future. If given channel holds, the pair reverses south and continues to trade within given trend.
Otherwise, it is likely that a breakout north occurs within the following sessions. However, important resistance level to look out for is the monthly PP at 83.89.
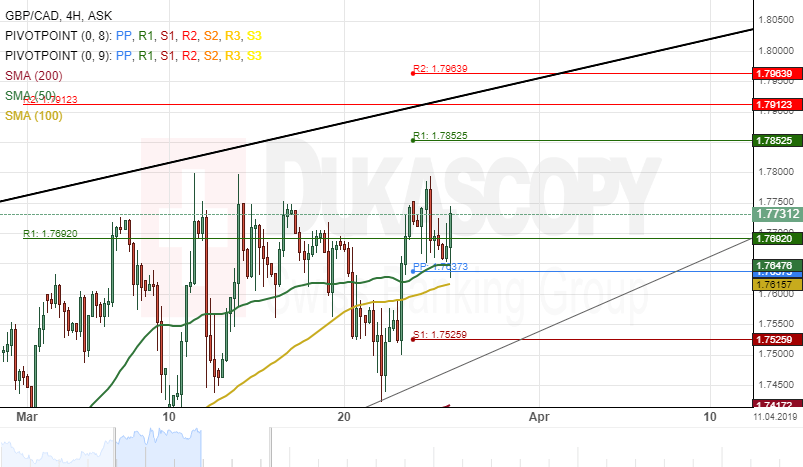
GBP/CAD 4H Chart: Remains near support at 1.7647
The British Pound has appreciated about 2.11% in value against the Canadian Dollar since last week's trading session. The currency pair re-tested June 2018 high level at 1.7789 during Monday's trading session.
The exchange rate was trading near a support cluster formed by the 50– hour simple moving average and the weekly PP at 1.7646 during the morning hours of today's session.
If this support cluster holds, the currency exchange rate will aim for a new 2019 high levels during the following trading sessions.
On the other hand, if the GBP/CAD pair passes the cluster as mentioned above, bearish traders could push the pair towards the 200-hour SMA at 1.7411.
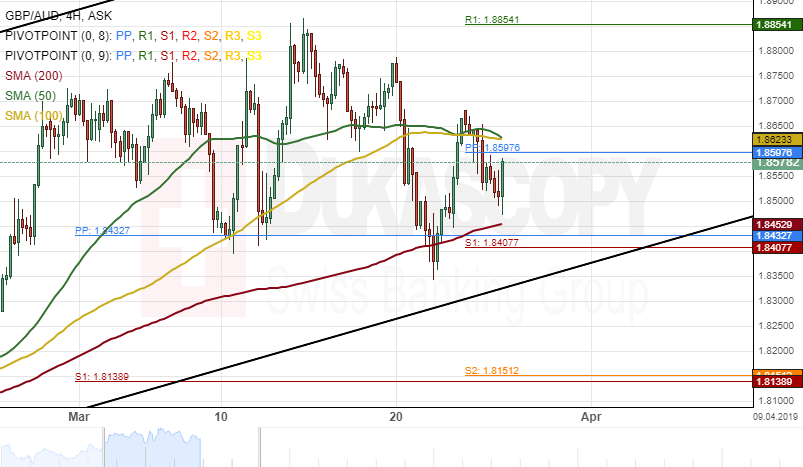
GBP/AUD 4H Chart: Awaits Brexit agreement vote
The Pound Sterling has depreciated about 2.31% in value against the Australian Dollar since Tuesday last week. The currency pair reached February 8 support level at 1.8339 during last week's trading session.
Everything being equal, it is likely that the GBP/AUD exchange rate will continue its decline during the following trading sessions. The potential downside target will be near a support cluster at 1.8151.
However, taking into considerations the political event that is happening in the United Kingdom, the technical analysis might not support the descriptions as mentioned above.
Author

Dukascopy Bank Team
Dukascopy Bank SA
Dukascopy Bank stands as an innovative Swiss online banking institution, with its headquarters situated in Geneva, Switzerland.


