Patterns: USD/THB AUD/SGD
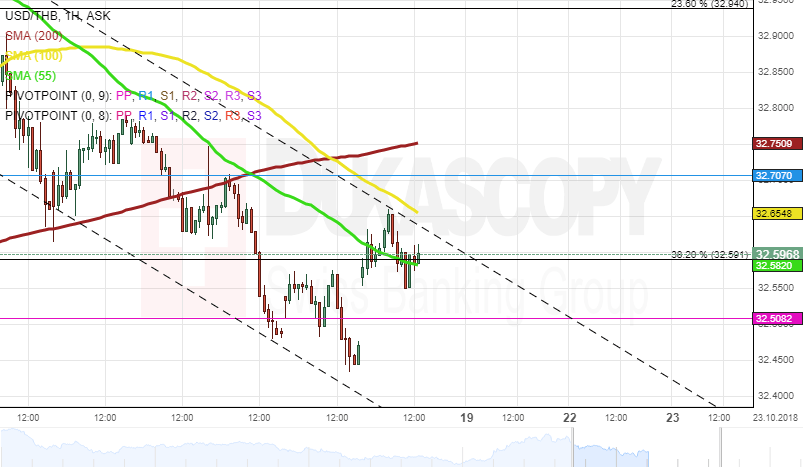
USD/THB 1H Chart: Bearish momentum
The US Dollar has been depreciating against the Thai Baht in a short-term descending channel after the exchange rate reversed from the upper boundary of a long-term descending channel at 33.05.
As apparent on the chart, the currency pair has breached the support level formed by a combination of the 100– and 200-period SMAs (4H). Given this fact, it is likely that the downside momentum still prevails in the nearest time. The most probable downside target during the following trading sessions is the Fibonacci 50.00% retracement at 32.31.
In the unlikely event that some bullish pressure still prevails in the market, the US Dollar should not exceed the Fibonacci 23.60% retracement at 32.94.
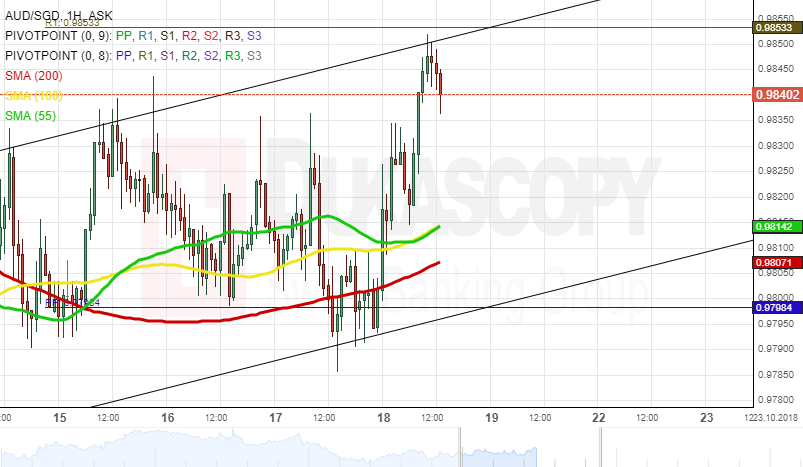
AUD/SGD 1H Chart: Strong support found
Upside risks dominated the AUD/SGD currency pair, thus sending the Australian Dollar 0.92% higher against the Singapore Dollar. This gradual increase in price began at the beginning of October when the rate reversed from the bottom boundary of falling wedge.
If looking at the pair's current movement, it has breached the 55-, 100– and 200-hour SMAs on the 1H time frame. Thus, it is expected that these lines help to support the rate, thus leading to further advance.
However, technical indicators for the 1D and 1W suggest that bearish momentum might occur soon. It is unlikely that the pair falls below the monthly S1 at 0.9971.
Author

Dukascopy Bank Team
Dukascopy Bank SA
Dukascopy Bank stands as an innovative Swiss online banking institution, with its headquarters situated in Geneva, Switzerland.


