Patterns: USD/RUB, USD/NOK
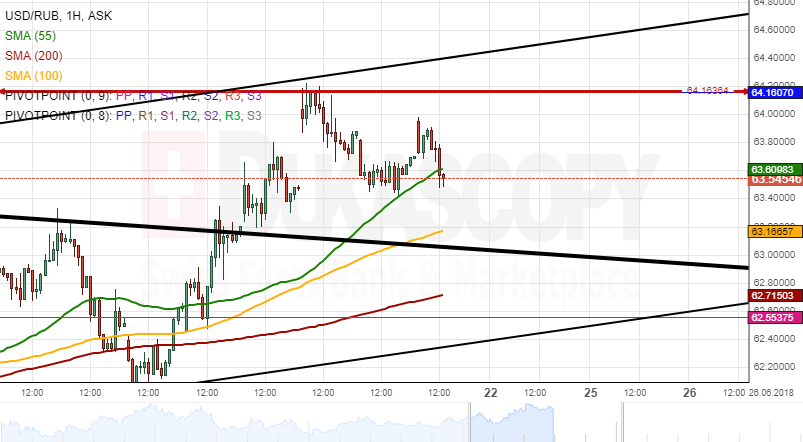
USD/RUB 1H Chart: Rate approached June high
The USD/RUB exchange rate has been bounded in a symmetrical triangle since early April. The pair managed to remain in this pattern for several weeks prior to breaking to the upside late last week. As a result, the Greenback continued to trade in a six-week ascending triangle.
The US Dollar reached a June peak against the Russian Ruble at 64.16 earlier this week—a level which have already provided strong resistance.
From theoretical point of view, the rate should edge lower during the following days to retrace from the breached triangle pattern near 62.50. This support level is likewise strengthened by the monthly PP and the 55– and 100-period (4H) SMAs.
However, the 55-hour SMA might guide the pair higher for a brief period of time and above the aforementioned June high before the expected decline takes place.
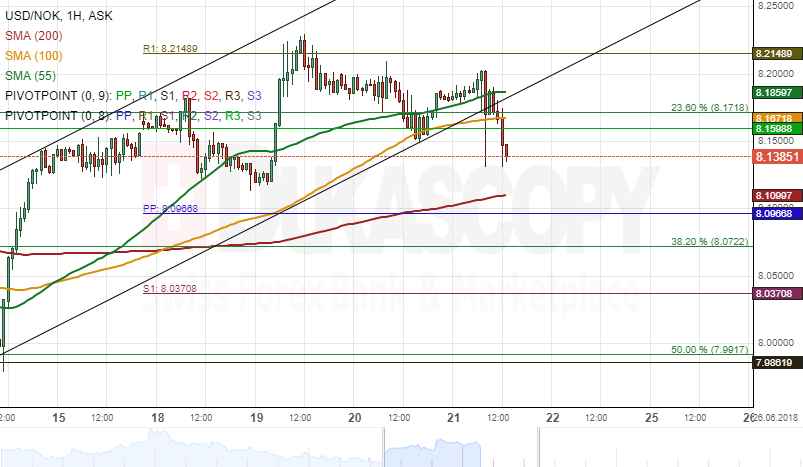
USD/NOK 1H Chart: Bearish in medium term
USD/NOK is trading in a long-term ascending channel. The rate bounced off its upper boundary at 8.33—its highest position in 2018 - late in May.
Subsequently, the US Dollar initiated a new wave down towards the other senior channel line located circa 7.90. This bearish movement was stopped by the monthly S1, the 50.00% Fibonacci retracement and the 55– and 200-day SMAs at the 8.00 mark. This resulted in a reversal back to the upside.
It seems that the pair might be ready to breach the short-term ascending channel to the downside, thus resuming its decline until the bottom channel line in the 8.00/05 range is reached somewhere in July. A possible confirmation of this bearish scenario should be provided by the US Dollar breaching the combined support of the 55-, 100– and 200-period (4H) SMAs at 8.10.
Author

Dukascopy Bank Team
Dukascopy Bank SA
Dukascopy Bank stands as an innovative Swiss online banking institution, with its headquarters situated in Geneva, Switzerland.


