Patterns: USD/MXN USD/ILS
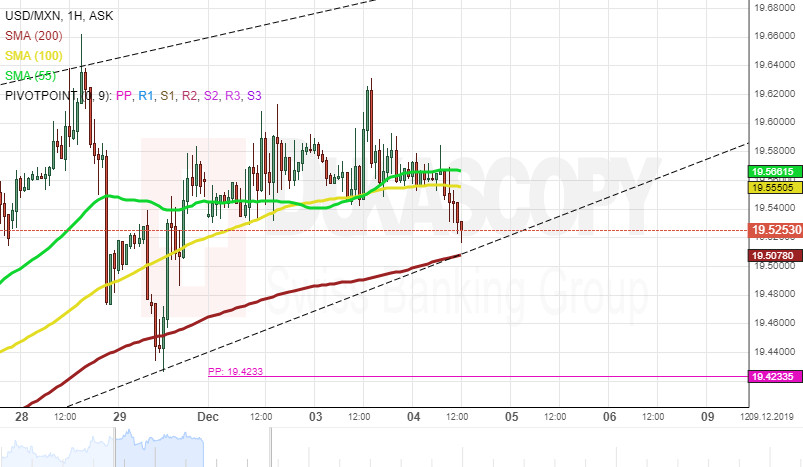
USD/MXN 1H Chart: Two scenarios likely
The US Dollar has been appreciating against the Mexican Peso since the middle of November. This movement has been bounded within the rising wedge pattern.
From a theoretical perspective, it is likely that a breakout south could occur within the following reading sessions. In this case the USD/MZN exchange rate could target the Fibonacci 38.205 retracement at 19.21.
However, note that the currency pair is supported by the 55-, 100– and 200-hour moving averages. Therefore, the pair could continue to trade upwards in the nearest future. Important level to look out for is the Fibonacci 50.00% retracement at 19.75.
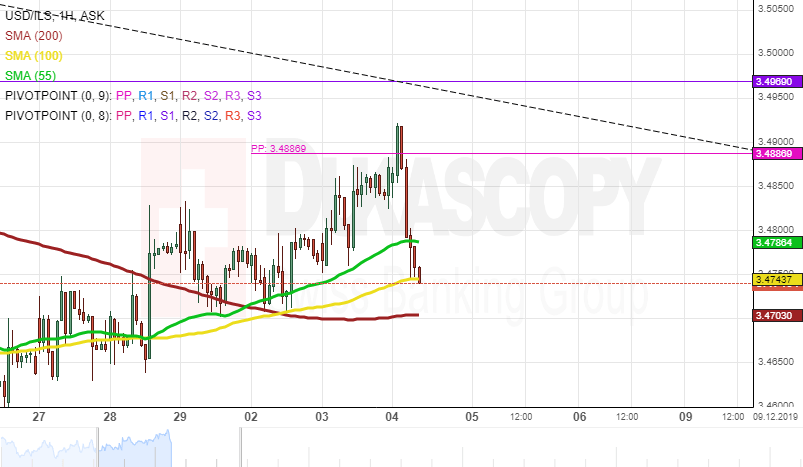
USD/ILS 1H Chart: Falling wedge pattern in sight
The USD/ILS currency pair continued to trade downwards within the falling wedge pattern. As apparent on the chart, the pair has already reversed south from the upper pattern line.
From a theoretical point of view, it is likely that the exchange rate could trade downwards within the given pattern in the nearest future. Also, a breakout north could occur in the medium term. In this case the rate could reach the Fibonacci 50.00% retracement at 3.5565.
However, note that the currency pair is supported by the 100– and 200-hour moving averages. Therefore, a breakout north could occur in the nearest future.
Author

Dukascopy Bank Team
Dukascopy Bank SA
Dukascopy Bank stands as an innovative Swiss online banking institution, with its headquarters situated in Geneva, Switzerland.


