Patterns: USD/MXN, SGD/JPY

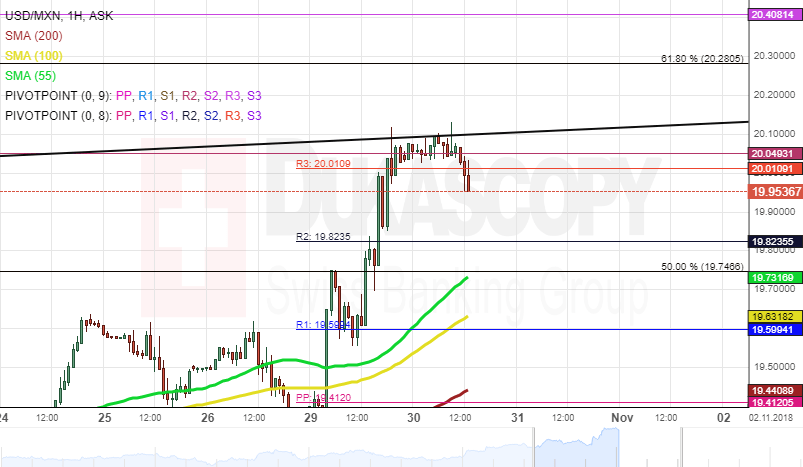
USD/MXN 1H Chart: Medium-term channel in sight
The US Dollar has been appreciating against the Mexican Peso since the middle of October when the currency pair reversed from the lower boundary of a medium-term ascending channel near 18.75.
As apparent on the chart, the rate is testing the upper channel line located near 20.10. It is most likely that a breakout from given channel occurs in the nearest future. A potential upside target is the monthly R3 at 20.41.
Meanwhile, technical indicators demonstrate that there is still some downside potential in the market before bulls are able to prevail in the market again.
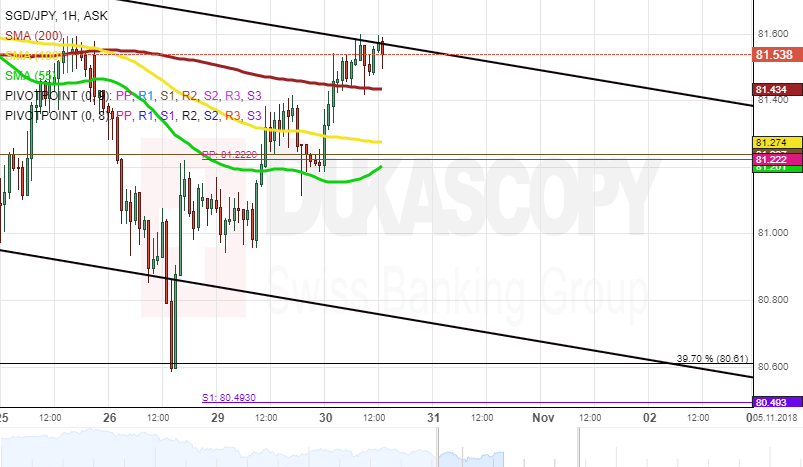
SGD/JPY 1H Chart: Short-term decline expected
Downside risks prevailed in the market, thus sending the Singapore Dollar 2.60% lower against the Japanese Yen.
Given that the pair is pressured by the 200-period SMA (4H) at 81.96, the general direction is expected to remain south within the scope of the next week. Two important levels to look out for are the monthly S1 at 81.24 and the Fibonacci 39.80% retracement at 80.61.
However, this decline might not be immediate, as some upside pressure is likely to push the exchange rate up to the the weekly R1 at 81.86.
Author

Dukascopy Bank Team
Dukascopy Bank SA
Dukascopy Bank stands as an innovative Swiss online banking institution, with its headquarters situated in Geneva, Switzerland.


