Patterns: NZD/CHF NZD/JPY

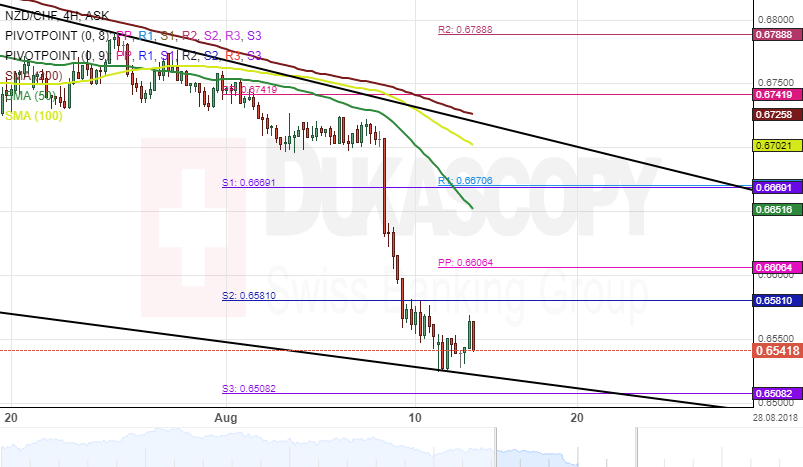
NZD/CHF 4H Chart: Downside potential
The New Zealand Dollar has depreciated 2.92% against the Swiss Franc since August 8. At the time, the pair pullback from the monthly pivot point at 0.6741 and began a new movement down in a descending channel. During the short period of decline, the rate breached some significant support level. Namely, a support cluster formed by the combination of the weekly and the monthly PPs near the 0.6670 mark.
Given that technical indicators remain bearish on both the smaller and the larger time frames, it is likely that the Kiwi edged lower during the following trading sessions for potential near the weekly S1 at 0.6488.
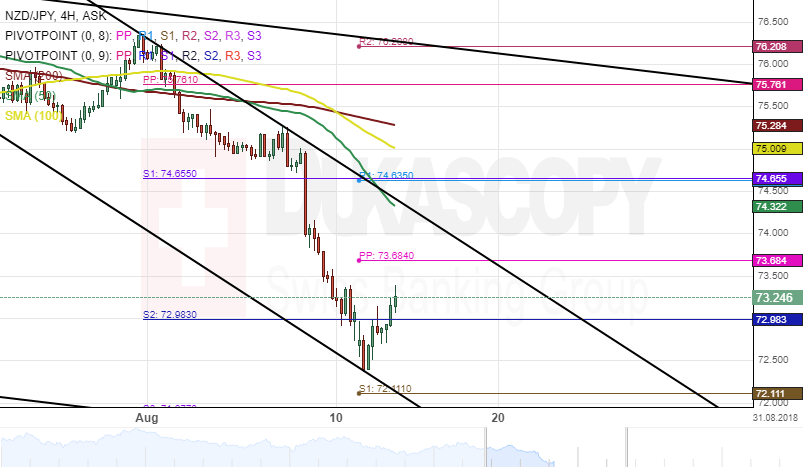
NZD/JPY 4H Chart: Decline continues
The New Zealand Dollar has been weakening its position against the Japanese Yen since the end of July. This depreciation started when the pair reversed from the upper boundary of a descending channel. As a result, the Kiwi has been trading in a junior descending channel since the beginning of August.
Bears momentum were stable during the past few weeks and thus pushing the currency pair to a two-year low level at the 72.30 mark.
Technical indicators on the daily time-frame suggest that the bearish sentiment is likely to continue during the following trading sessions. The nearest barrier that could hinder the bearish momentum is at 72.11 formed by the weekly PP.
Author

Dukascopy Bank Team
Dukascopy Bank SA
Dukascopy Bank stands as an innovative Swiss online banking institution, with its headquarters situated in Geneva, Switzerland.


