Patterns: GBP/CAD, ZAR/JPY
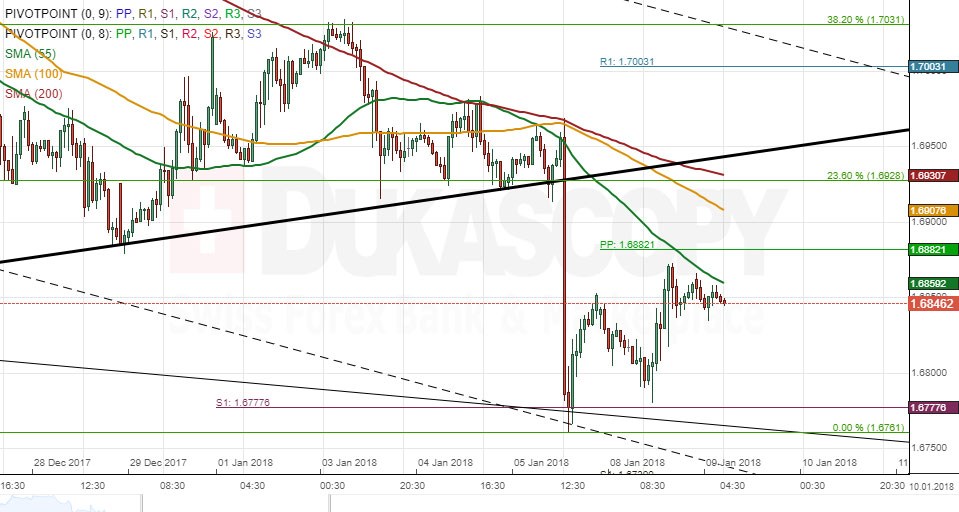
GBP/CAD 1H Chart: Possible reversal from channel
GBP/CAD was guided by an ascending channel since mid-August prior to breaching this pattern last Friday in response to solid Canadian employment data. As a result, the Pound fell to the monthly S1 at 1.6778. From theoretical point of view, the pair should go for a retracement from the bottom channel line circa 1.6950. However, given that the 55-hour SMA and the weekly PP are located nearby, this scenario might not be realised in this session, thus leaving the rate in the 1.6800/50 territory. Technical indicators suggest that there might be a change in sentiment within the following trading sessions, thus allowing for the rate to reach the aforementioned 1.6950 are, likewise reinforced by the 100– and 200-hour SMAs and the 23.60% Fibo retracement.
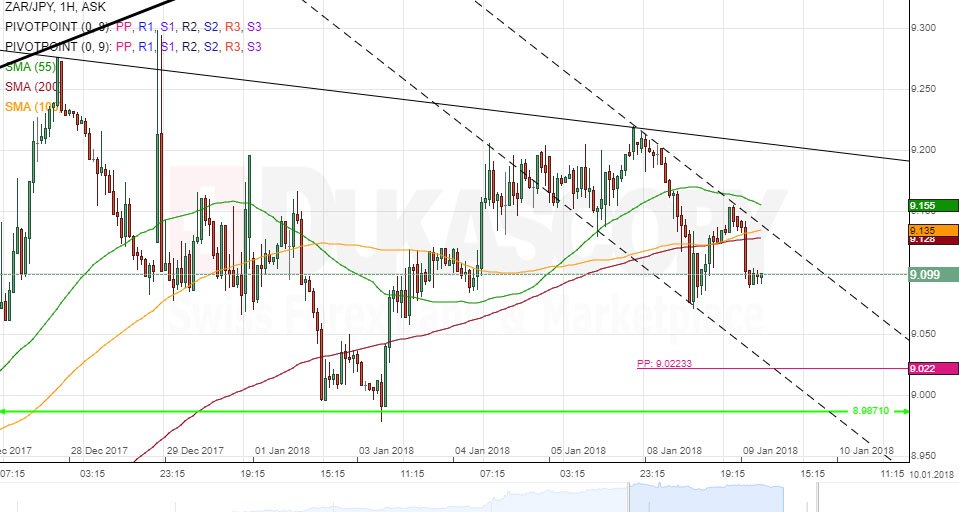
ZAR/JPY 1H Chart: Pair moves in triangle
The prevailing pattern that has guided ZAR/JPY for the past two-and-a-half months is a channel up. The latest test of its upper boundary occurred on December 27 when the South African Rand reversed from the 9.27 area. Along the way, a descending triangle was likewise formed with the bottom boundary being the 8.9871 mark and the upper—a declining trend-line. The positioning of both patterns and the strength of the nearest resistance cluster suggest that the pair is likely to decline within this week. The pair should largely respect the triangle until the bottom channel boundary is reached in the 8.95/9.05 territory. Meanwhile, the dashed short-term channel is unlikely to hold for long, as the pair is expected to decline in a flatter manner.
Author

Dukascopy Bank Team
Dukascopy Bank SA
Dukascopy Bank stands as an innovative Swiss online banking institution, with its headquarters situated in Geneva, Switzerland.


