Patterns: EUR/HUF, EUR/CZK, NZD/JPY, NZD/CAD

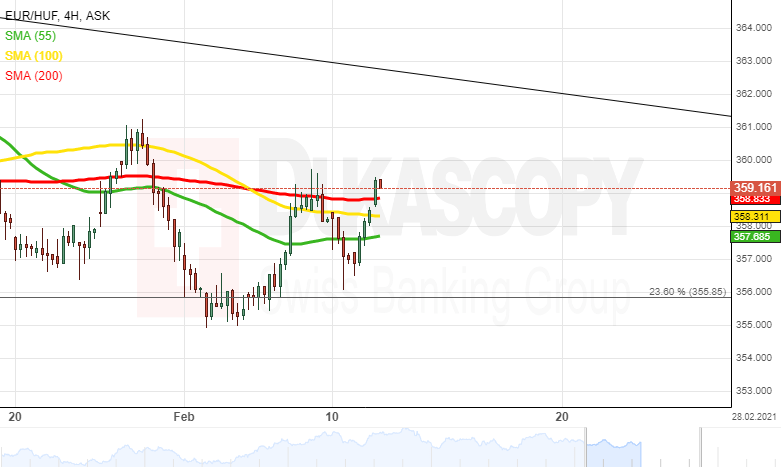
EUR/HUF 4H Chart: Downside potential could prevail
Since the beginning of November, the EUR/HUF currency pair has been trading downwards within a falling wedge pattern.
From a theoretical point of view, it is likely that the exchange rate could continue to move within the predetermined pattern in the medium term. In this case the rate could decline to 350.00 by the middle of March.
In the meantime, note that the currency pair could gain support from the Fibo 23.60% at 355.85. Thus, a breakout north could occur, and the pair could re-test the 370.00 level.
EUR/CZK 4H Chart: Bears could prevail
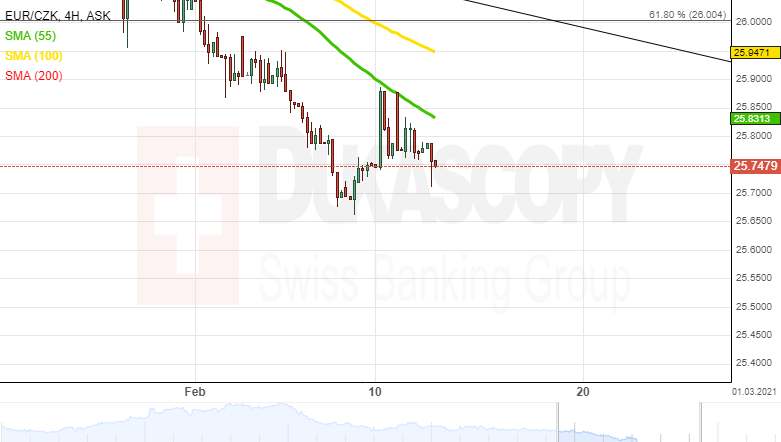
Since the beginning of December, the EUR/CZK exchange rate has been declining, pressured by a descending trend line.
Given that the currency pair is pressured by the 55-, 100–" and 200-period moving averages in the 25.85/26.00 range, it is likely that some downside potential could prevail in the market. The pair could target the 24.80 level in the medium term.
In the meantime, it is unlikely that bulls could prevail in the market, and the exchange rate could exceed the 26.40 mark due to the resistance level–"the Fibo 50.00%.
NZD/JPY 4H Chart: Buying signals
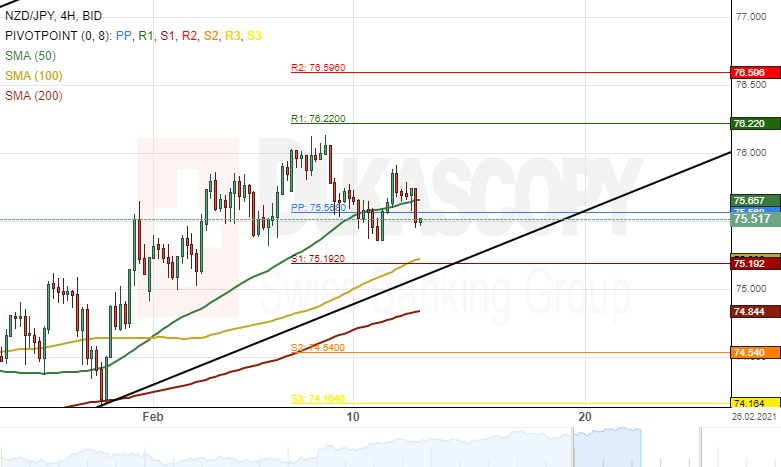
The New Zealand Dollar has surged by 1.48% against the Japanese Yen since February 1. The currency pair tested the 76.00 level during this week's trading sessions.
All things being equal, the exchange rate could continue to edge higher during the following trading sessions. The potential target for bullish traders would be near the 77.00 area.
However, the weekly resistance level at 76.22 could provide resistance for the NZD/JPY currency exchange rate during the following trading sessions.
NZD/CAD 4H Chart: Selling signals
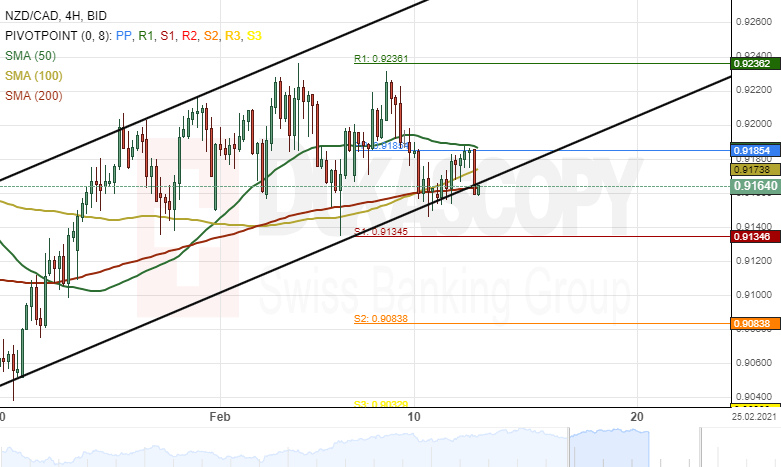
The New Zealand Dollar has declined by 0.89% against the Canadian Dollar since the beginning of February. The currency pair tested the lower line of an ascending channel pattern during this week's trading sessions.
Technical indicators suggest selling signals on the 4-hour time frame chart. Most likely, the exchange rate could continue to edge lower during the following trading sessions.
However, a support cluster formed by the 100–" and 200–" period SMAs at 0.9162 could provide support for the currency exchange rate in the shorter term.
Author

Dukascopy Bank Team
Dukascopy Bank SA
Dukascopy Bank stands as an innovative Swiss online banking institution, with its headquarters situated in Geneva, Switzerland.
















