Patterns: EUR/AUD, EUR/CAD, USD/CNH, USD/THB
EUR/AUD 4H Chart: Could make brief retracement
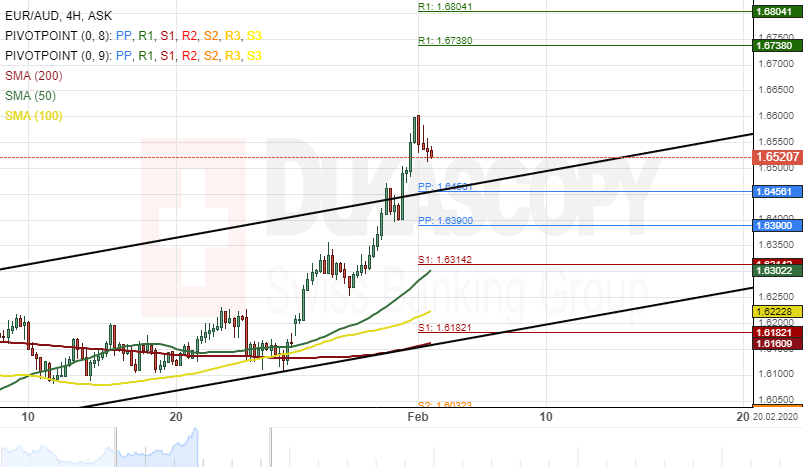
The common European currency has surged by 3.89% in value against the Australian Dollar since January 1. A breakout occurred through the upper boundary of an ascending channel pattern at 1.6456 during Friday's trading session.
Given that a breakout had occurred, the EUR/AUD exchange rate will most likely continue to edge higher. The potential target for bullish traders would be near the psychological resistance level at 1.6750.
However, the currency exchange rate is expected to make a brief downside retracement towards the weekly S1 at 1.6314 within this week's trading sessions.
EUR/CAD 4H Chart: Could edge lower
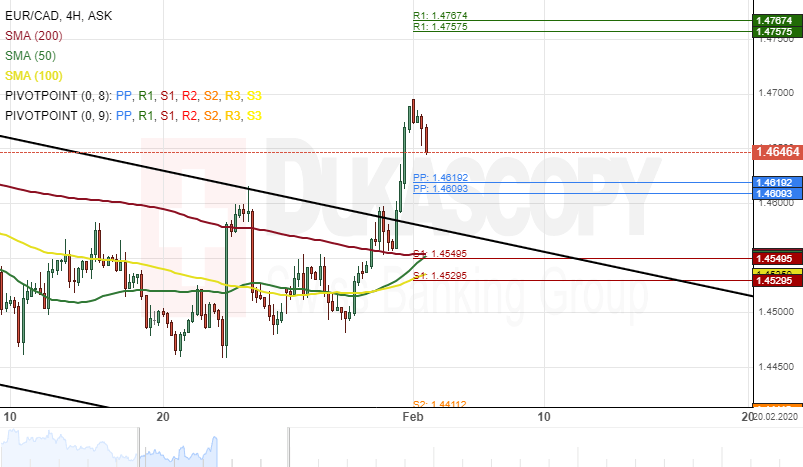
The European single currency has surged by 239 pips or 1.65% in value against the Canadian Dollar since last week's trading sessions. A breakout occurred through the upper border of a descending channel pattern on January 31.
All things being equal, the EUR/CAD exchange rate will most likely continue to trade bullish during the following trading sessions. The potential target for the pair will be near a resistance cluster formed by the weekly R1 and the monthly R1 at 1.4767.
Although, bearish traders might drive the currency exchange rate towards the weekly S1 and the 200– hour simple moving average at 1.4549 within this week's trading sessions.
USD/CNH 1H Chart: Bulls could prevail
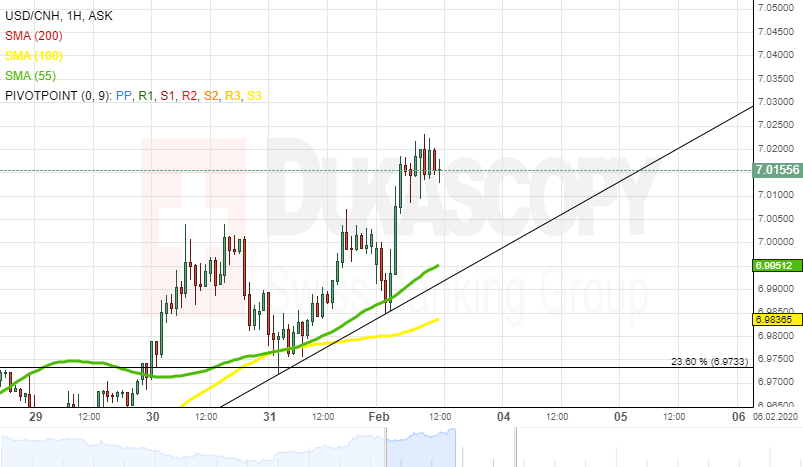
The USD/CNH currency pair has been trading upwards since the middle of January when it failed to surpass the Fibonacci 38.20% retracement at 6.8333. Currently, the pair is trading at 7.0200 level.
Note that the exchange rate is supported by the 55– and 100-hour moving averages, currently located circa 6.9900. Thus, some upside potential could continue to prevail in the market. The rate could reach the 2019 high at 7.2000.
However, note that the currency pair would have to surpass the monthly R1 at 7.0573. If the given resistance level holds, a reversal south could occur in the nearest future, and the pair could re-test the Fibo 38.20%.
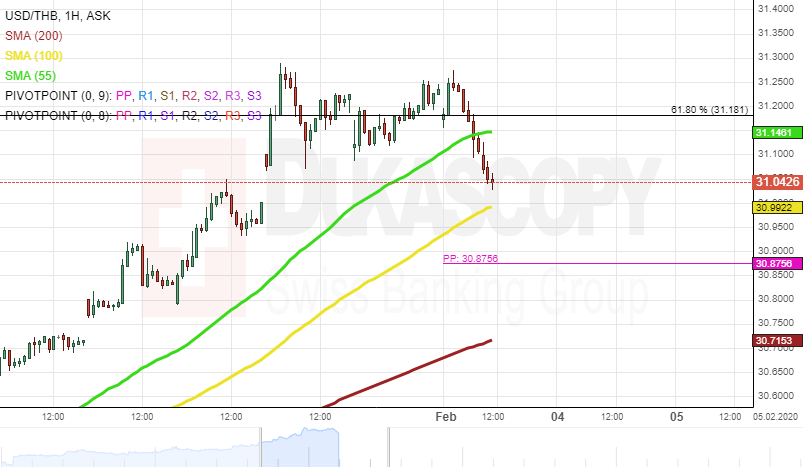
USD/THB 1H Chart: two scenarios likely
The US Dollar has been appreciating against the Thai Baht since the beginning of January after the USD/THB currency pair reversed north from the Fibo 100.00% at 29.75.
Currently, the exchange rate is testing the resistance level formed by the Fibo 61.80% at 31.18. Note that the rate supported by the 100– and 200-hour SMAs. Thus, some upside potential could prevail, and the rate could target the Fibo 38.20% at 32.07.
However, if the given resistance level holds, a reversal south could, and the currency pair could re-test the Fibo 100.00% in the medium term.
Author

Dukascopy Bank Team
Dukascopy Bank SA
Dukascopy Bank stands as an innovative Swiss online banking institution, with its headquarters situated in Geneva, Switzerland.


