Patterns: CHF/SGD, USD/CHF

CHF/SGD 1H Chart: Franc breaks trend-line
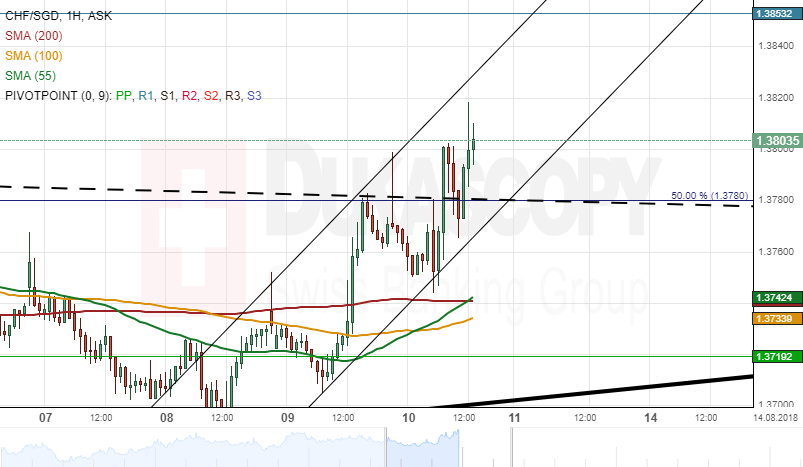
The CHF/SGD currency pair has been consolidating in the 1.3668/1.3785 range for a month now. Thus, the Swiss Franc failed to accelerate against the Singapore Dollar and approach the upper boundary of the senior channel.
On Friday, the pair was still trading in the aforementioned range. However, it did break to the upside a downward-sloping trend-line and the 50.00% Fibonacci retracement at 1.3780.
The rate is supported by the 55-, 100– and 200-period SMAs on both the 1H and 4H time-frames. This is likely to add some bullish pressure in the market and consequently result in appreciation of the Franc. An important resistance level is the monthly R2 at 1.3950. The upper boundary of the senior channel is likewise located nearby circa 1.4050.
USD/CHF 1H Chart: Finds support at 55-day SMA
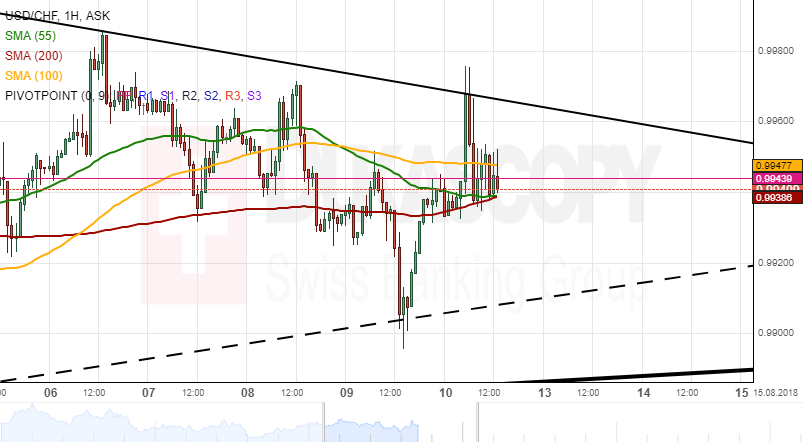
The US Dollar has been trading in an ascending triangle against the Swiss Franc since mid-April. The rate re-tested its bottom line on July 31 and has since edged slightly higher.
A steeper appreciation has been restricted by a medium-term channel along which the US Dollar has been lingering for a couple of sessions. It does indicate that the pair may trying to breach this line and most presumably advance towards the upper wedge line at 1.0060—its highest position since May 2018.
The US Dollar is currently supported by the 55– and 100-hour and the 55-day SMAs at 0.9926. If this level is to hold strong, the aforementioned bullish scenario is likely to take place. Conversely, a southern breakout from this 0.9926 level should result in the pair dashing through the bottom wedge line near 0.9890 and a subsequent test of either the 23.60% Fibonacci retracement or the monthly S1 at 0.9850 and 0.9820, respectively.
Author

Dukascopy Bank Team
Dukascopy Bank SA
Dukascopy Bank stands as an innovative Swiss online banking institution, with its headquarters situated in Geneva, Switzerland.


