Patterns: CAD/CHF, GBP/CHF, AUD/JPY, GBP/JPY

CAD/CHF 1H Chart: Long-term channel in sight
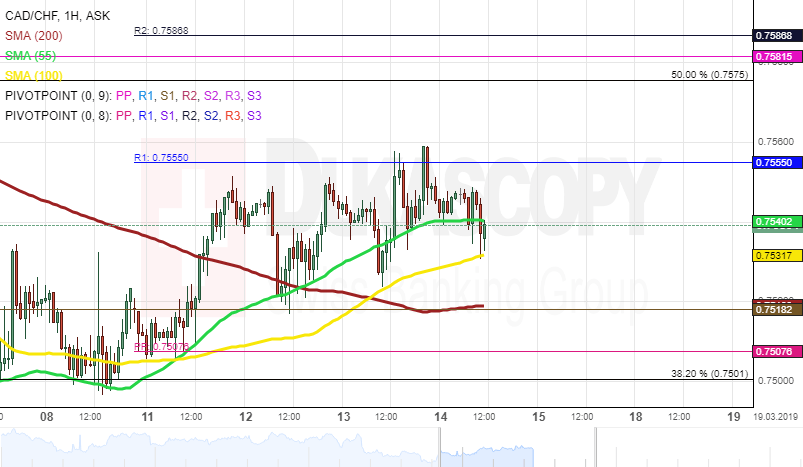
The CAD/CHF currency pair has been testing the upper boundary of the long-term descending channel located circa 0.7615 since the beginning of February.
Currently, the exchange rate is testing the resistance level formed by the weekly R1 at 0.7556. Given that the pair is being supported by the 55-, 100– and 200-hour SMAs, it is likely that some upside potential prevails in the market, and the rate re-tests the upper channel line in the nearest future. If given channel holds, a reversal south occurs within following sessions.
Otherwise, a breakout north occurs soon. Potential upside target is the psychological level at 0.7700.
GBP/CHF 1H Chart: Two scenarios likely
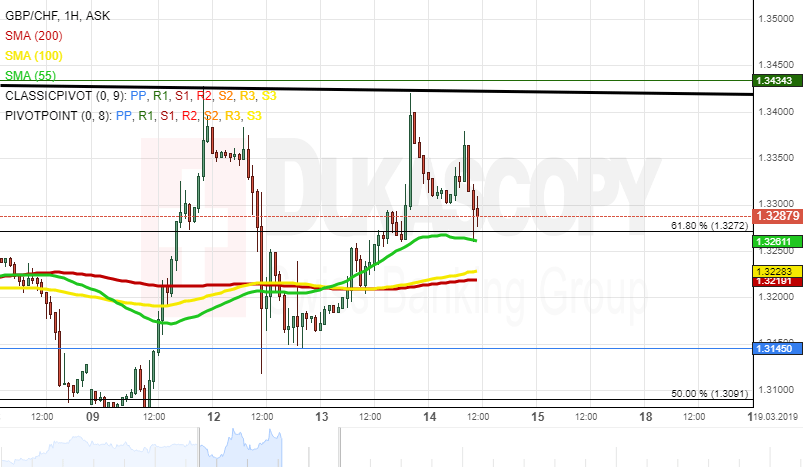
The GBP/CHF exchange rate has surpassed the resistance level formed by the Fibonacci 61.80% retracement at 1.3272 and tested the upper boundary of the long-term descending channel located circa 1.3425.
As apparent on the chart, the currency pair is trading near the upper channel line. From a theoretical perspective, a reversal north should occur within following sessions. Important support level to look out for is the Fibonacci 50.00% retracement at 1.3091.
However, given that the rate is being supported by the 55-, 100– and 200-hour SMAs, it is likely that bulls prevail in the market, and the rate re-tests the upper trend boundary. If given channel does not hold, a breakout north occurs in the nearest future.
AUD/JPY 4H Chart: Stranded between SMAs
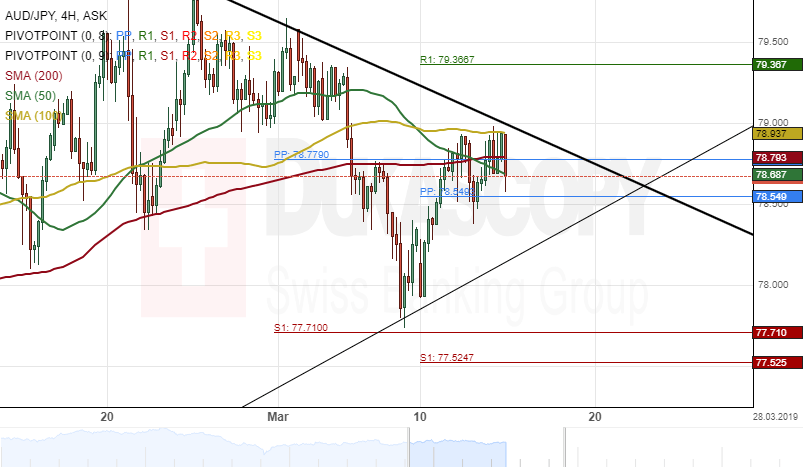
The Australian Dollar has been trading in a long-term descending channel pattern against the Japanese Yen. However, the currency pair has revealed a new medium-term ascending trendline since the beginning of 2019.
The exchange rate was stranded between SMAs during the morning hours on Thursday. Technical indicators flash strong sell signals on the daily time-frame chart. Therefore, a decline towards the lower band of an uptrend line at 78.00 could be expected.
On the other hand, bullish traders might pressure the pair within this trading session.
GBP/JPY 4H Chart: Bullish sentiment
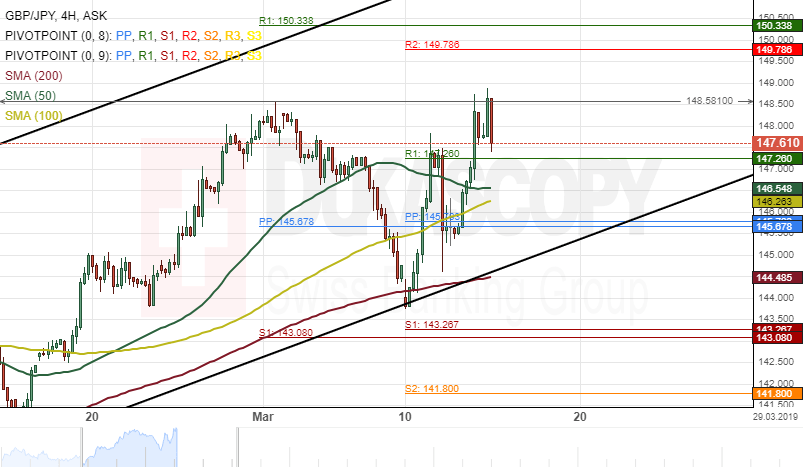
The Pound Sterling has appreciated about 500 base points against the Japanese Yen during the past one week. The currency pair was supported up by the 200-hour simple moving average.
Technical indicators flash bullish signals on both the 4(H), daily and weekly time frames chart. Therefore, the exchange rate could end this week's trading sessions with bullish momentum.
However, traders need to be aware of a significant resistance level at 148.58. If the pair breaks the level, bullish traders could push the rate higher during the following trading sessions.
Author

Dukascopy Bank Team
Dukascopy Bank SA
Dukascopy Bank stands as an innovative Swiss online banking institution, with its headquarters situated in Geneva, Switzerland.


