Patterns: Brent.CMD/USD, Light.CMD/USD

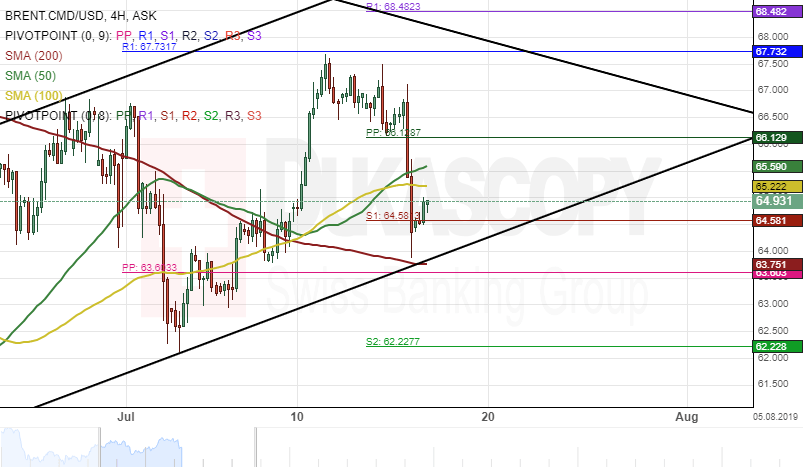
BRENT.CMD/USD 4H Chart: Sets for breakout
After the Brent crude oil tested the monthly R1 at 67.73 on July 11, the commodity made a U-turn south. As a result, the pair has lost about 5.47% in value since last week's trading sessions.
Currently, BRENT.CMD/USD is trading near the bottom line of an ascending channel pattern. From a theoretical point of view, a breakout could occur during the following trading sessions.
If this breakout occurs, the pair could aim for a swing low at 60.32 during next week's trading sessions.
On the other hand, the 200-hour simple moving average at 63.74 might provide support for the pair within this week's sessions.
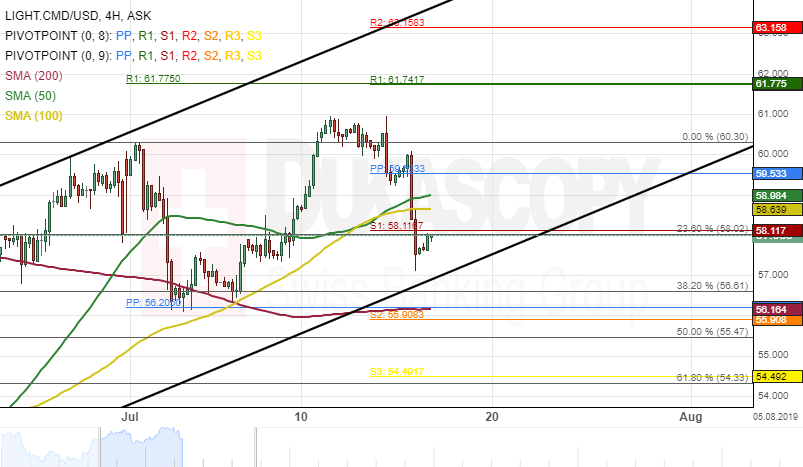
LIGHT.CMD/USD 4H Chart: Could edge lower
The Light crude oil prices have depreciated about 6.23% in value since last week's trading sessions. The commodity breached both the 50– and 100-hour SMAs at 58.94 during yesterday's session.
Most likely, the LIGHT.CMD/USD pair could continue its southern movement in the coming days. The pair might aim for the 61.80% Fibonacci retracement level during next week's trading sessions.
However, a support cluster formed by the 200-hour simple moving average and the combination of the weekly and the monthly PPs at 56.14 could provide significant support for the pair in the nearest future.
Author

Dukascopy Bank Team
Dukascopy Bank SA
Dukascopy Bank stands as an innovative Swiss online banking institution, with its headquarters situated in Geneva, Switzerland.


