Past performance

NZD, WMDs, and seasonality
First up: The NZDJPY call was not great. The RBNZ came in right on the screws, pretty much, and NZD is a tad stronger while USDJPY skittered back higher. The option has one more day on it, but at this point it’s purely a random prayer for MOF intervention.
My mention of PURR was very badly timed, too, as crypto could not shake off the semiconductor malaise. In happier news, it does look like my idiosyncratic view on flows into KRW for the SK Hynix ADR is probably on the money as USDKRW crumples despite USD strength everywhere else. I still need KRW to stay strong for another week or so for the 5X leverage to pay off, so there is still plenty of time for things to go horribly wrong. I am not cheering.
Onward and upward. Complete results for all sidebar trade ideas are provided in detail on the pages that follow as I conduct my twice-yearly recap of trading idea performance.
Much to the dismay of Democrats and Independents, the U.S. finds itself embroiled in what looks like another war with no clear objective or endgame in the Middle East despite promises it would be wrapped up in a few weeks. Off and on bombings and drone attacks are hard to trade as the market now trades “escalation is bullish USD” and “De-escalation is… Bearish EURUSD”. Hmm. As I often say: It doesn’t have to make sense. The best bet is probably to ignore the war headlines and stick to whatever view you had before they dropped.
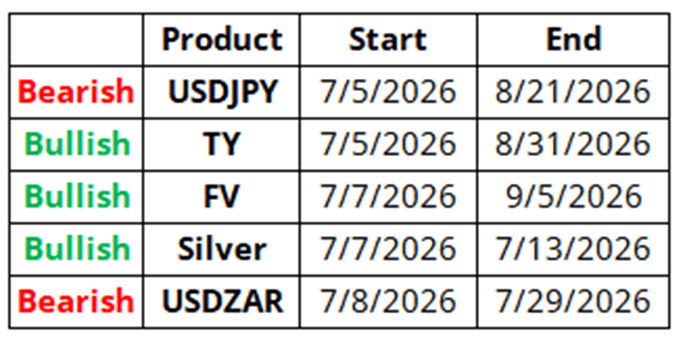
We are entering a bullish seasonal stretch here for equities, silver, and bonds. Let’s see if seasonality can help reverse a major swoon. Here are the almanac signals for this week and on the next page is the average seasonal path of USDJPY.
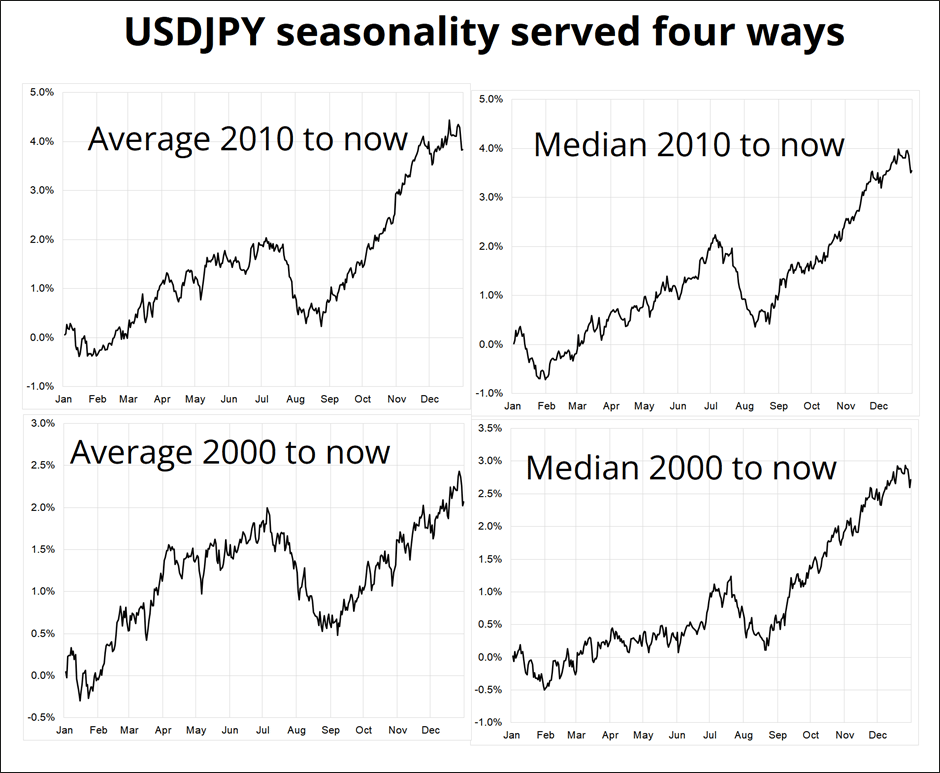
When I publish charts of seasonal patterns, I am often asked about various aspects of the methodology. “What is the lookback?” and “Do you use median or average?” are the two most often-asked questions. They are good questions! The reality is that when you have a decent sample size, the results look the same regardless of which methodology you choose. Here, for example, is median and average, with a year 2000 and 2010 lookback. Since our goal is to find the turning points and trend zones, the magnitude (y-axis) doesn’t matter. All we are looking for is high Sharpe zones, turning points, trends, and steep slopes. However you slice and dice it, mid-July to early September is the worst time of year to own USDJPY.
There’s more than one way to perform a feline dermal excision
It is worth noting that some portion of this seasonality is a relic of the direct link between treasury yields and USDJPY throughout most of the lookback period. If bonds rally in the bullish seasonal window this year, that does not provide any guarantee that USDJPY should go down. Still, you now have extended USDJPY longs, an approaching bearish seasonal window, and a perhaps overly simplistic, single-variable bullish USDJPY thesis based on Japanese fiscal policy. The thesis makes sense, but maybe loose fiscal / loose BOJ is priced in at this point and importer flow will cool as the price of oil softens. The only bearish USDJPY catalyst right now is MOF and that is a bit of a lotto ticket trade for now. All this to say that I am becoming skeptical of the USDJPY long trade but I’m not yet short.
H1 2026 trade ideas recap
Today is my trade ideas recap for H1 2026. On October 24th, 2017, I wrote the following after reading Philip Tetlock’s excellent book, Superforecasting:
One of Tetlock’s big beefs, which is a pet peeve of mine too, is the litany of forecasts that stream daily on CNBC, Bloomberg and the internet without any scrutiny or follow-up. Specifically, the relentless stream of “Crash Imminent” predictions is a complete joke. These inaccurate, one-way forecasters are not called out, they are instead deified as “the famed economist who correctly predicted the collapse of 2000 and 2008” etc.
Most analysts that get credit like this predict a crash every year or two and then claim credit in the very few years their call is right. There is no verification (and many forecasts are so open-ended they are impossible to verify) so anyone can make any prediction, and it is more important how famous they are, not how accurate they are. I don’t mean to pick on a specific website or forecaster—As an industry, Wall Street is simply terrible at following up on the flood of forecasts we make every day.
It is pretty weird how we don’t even have much data on who is good at forecasting the main US economic data, when this is easily verifiable with a bit of work. Anyone know the Brier Score of the top 10 forecasters of US economic data? Is their forecasting skill persistent? There are many reasons not to follow up on forecasts but most of them suit the forecaster not the users of the forecast.
For example, people sometimes ask me to publish my trade idea outcomes. I hesitate for four reasons:
1. If I am right a lot in am/FX but my real-world P&L isn’t that great, it looks bad and feels bad. “Great calls, Brent, but what’s with your teeny, little P&L?”
2. If I am wrong a lot, I look stupid. My credibility could be damaged.
3. If I am right a lot, it looks like I am bragging. Victory laps are annoying.
4. The purpose of am/FX is not to publish ideas which readers blindly follow. My goal is to help you make your own investment and trading decisions. To reveal my process and put stuff on your radar. Hopefully that helps you improve your process and plants seeds for good trades on your end.
The thing is, though, after reading Superforecasting I feel it’s lame and disingenuous to make forecasts and then not follow up. So, I will collect and publish my trade idea results. Caveats: My real-world trading P&L can differ dramatically from the P&L of the “Current Views”. Also: I cannot guarantee the accuracy of the data (though I present it, in full and I’m pretty sure it’s accurate). Past performance does not guarantee future results. Ask your doctor if am/FX is right for you.
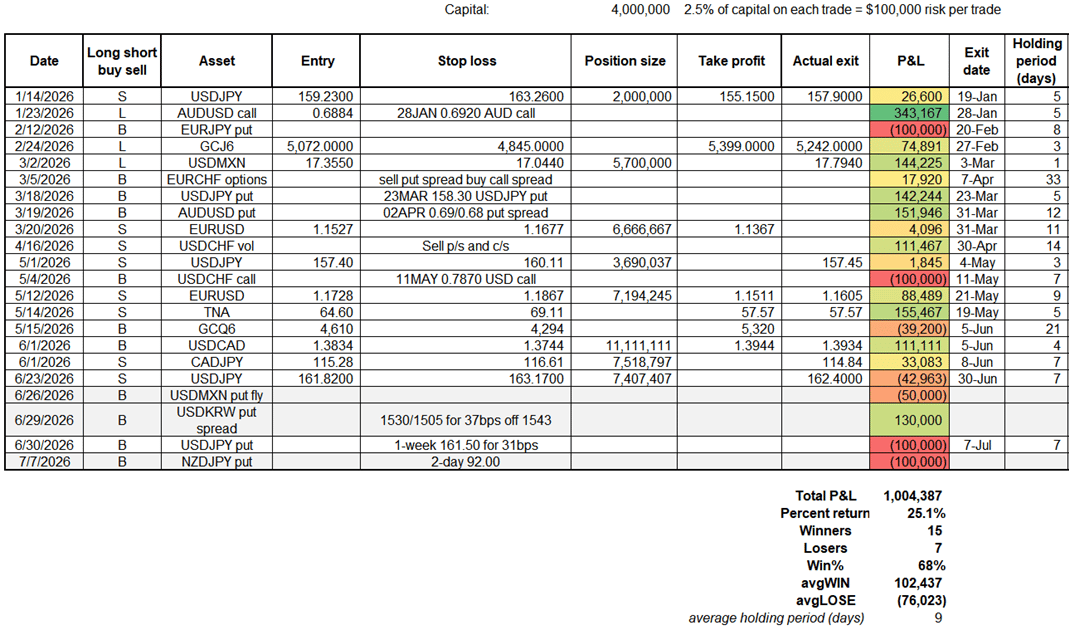
On the next page, you will find a detailed sheet that shows my trade ideas this year. They are all marked to market at the time I hit send on the email. In order for the trades to be comparable, I assume a portfolio with a $4m stop loss that risks $100,000 on each trade (2.5% of free capital). This is extremely conservative. The point is simply to normalize the trades because raw % returns on trades makes no sense. What makes sense is to normalize risk based on where the stop loss is. Tighter stops = bigger positions and vice versa. So, to be clear: I risk $100,000 on each trade, backing out the position size from the difference between the entry point and the stop loss. This is all fully explained in Chapter 11 of Alpha Trader. The main point of this exercise is transparency and accountability. The P&L realistically reflects your P&L if you did all the ideas in real time.
Am/FX trades for H1 2026
Takeaways
Super strong H1 as a 68% hit rate is way above my normal 55%/57%. The Win$ vs. Lose$ ratio was good, too. Trades were in all directions, which is usually a sign that I am not overly biased one way or the other on the USD or risk appetite. The more flexible and agnostic I am, the better I trade. The big winners were in options, and I did a good job of cutting a few losers early.
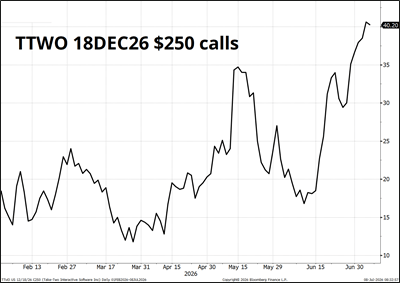
I had said early in January that I might publish some medium-term ideas and then update the results later. I don’t like putting them in sidebar because it gloms it up too much and creates a distraction. Given my average holding period is nine days, one might think that I have no edge in the medium term and I would agree. In fact, I only ended up publishing two medium term ideas: Long TLT in January (small loser) and buy December $250 calls in TTWO (idea published February 9, 2026). Those options cost $16 and are now at $40. If you happened to do that trade, I would say it’s a good time to take profit as a successful launch of GTA6 is now priced in.
H1 was good but now we’re in H2 and you’re only as good as your last trade.
Final thoughts
In case you have been hearing about the rejig of Core PCE that’s coming, here are some basic facts you’re your information. Starting with August 2026 PCE (released September 30), the BEA will change the deflation methodology for three categories: Portfolio management, legal services, and computer software. They don’t like
1. How portfolio management just goes up and down with the level of the SPX. The changes will mechanically reduce YoY Core PCE by around 0.2% retroactive to 2021. So, it’s a tiny bit dovish at the margin, but barely worth thinking about.
2. If I owe you a signed book, please be patient. It takes a long time to get the books, sign them, package them, do the post office shenanigans (customs forms, etc.) and send them. I would guess if you expect to get your book around mid-August, you will probably be positively surprised. If you expect it this week, you will be disappointed. I’m doing my best! :]
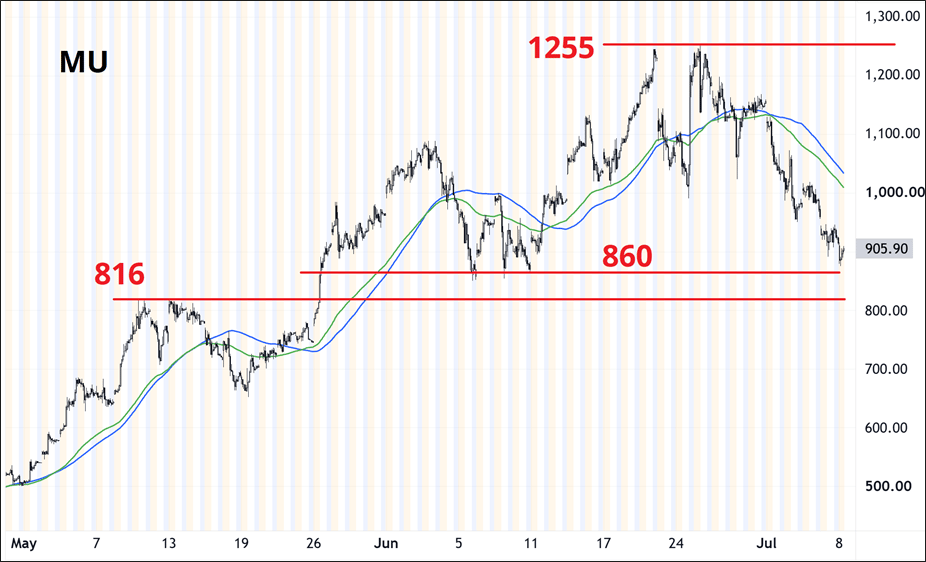
3. The double top in MU at 1255 has resolved and if you’re bullish, it’s probably about time to get long or add. The 816/860 zone is mega support.
Author

Brent Donnelly
Spectra Markets
Brent Donnelly is the President of Spectra Markets. He has been trading currencies since 1995 and writing about macro since 2004. Brent is the author of “Alpha Trader” (2021) and “The Art of Currency Trading” (Wiley, 2019).