Gold fell on its best news in weeks

The United States struck Iran again last night. The strikes answered Iran's attack on three tankers in the Strait, which Washington called a clear breach of the ceasefire, and the Treasury followed by cutting off Iran's license to sell oil. Crude oil price jumped almost 7%.
This is the setup every gold bull points to, a shooting war on the chokepoint that carries a fifth of the world's oil and a supply shock in the same night.
Gold fell more than 2%.
Silver fell almost 4%.
The safe-haven bid went to the dollar instead. This one morning explains the whole market.
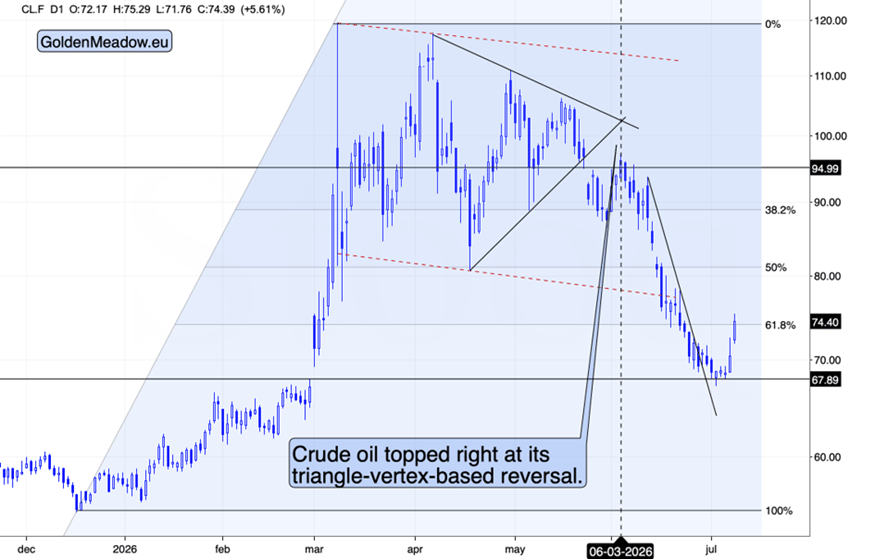
Crude surges 7% on fresh sanctions
Starting with oil, because oil is the cause. Iran hit three ships, the US hit Iran, and the Treasury pulled the waiver that let Iranian barrels reach the market. Supply and fear repriced at once, and crude ran nearly 7% to the upside. That is a real move, and it is the engine under everything else on the screen today.
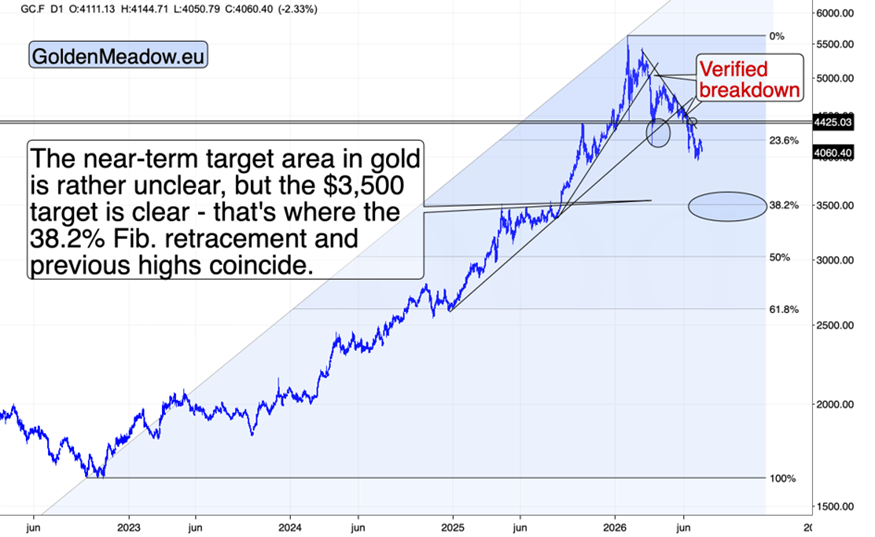
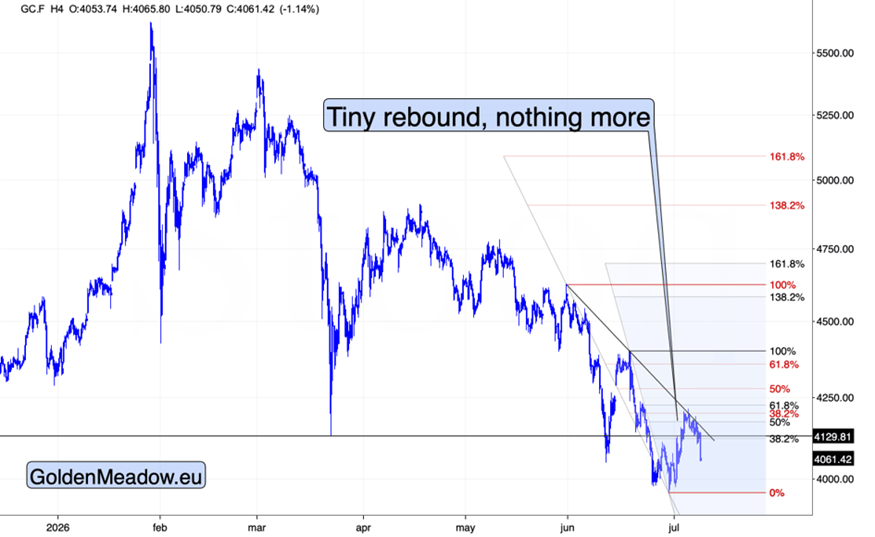
Now look at gold, and hold the two side by side. War back on the Strait, oil surging, US strikes overnight. In the story, most investors carry, that is the moment gold goes vertical. Instead, gold broke lower and gave back the bounce it had spent a week building.
Yesterday, I wrote that gold would not rally on a war headline. Today it did something more telling. It fell on one. A market that sells off on the exact news written to lift it is not waiting for a bigger catalyst. It is answering to a different master, and the master is not fear.
The master is the dollar and the rate behind it, and today shows both halves at work. Higher oil means higher inflation, and higher inflation keeps the Federal Reserve leaning toward hikes, which lifts real yields and raises the cost of holding metal that pays nothing. The oil shock also flows straight to the dollar. Higher energy prices push foreign central banks toward hikes as well, and the United States sells energy to the world, so a crude spike lifts the dollar while it sinks gold. That is why the safe-haven money went into the dollar this morning and not into the metal. The Federal Reserve's own record says the same in plain terms, that elevated energy prices and America's place as an energy exporter support the currency. This afternoon, the June meeting minutes arrive, and that meeting leaned hawkish. If the record reads as hard on inflation as I expect, it firms the dollar again and leans on gold one more time.
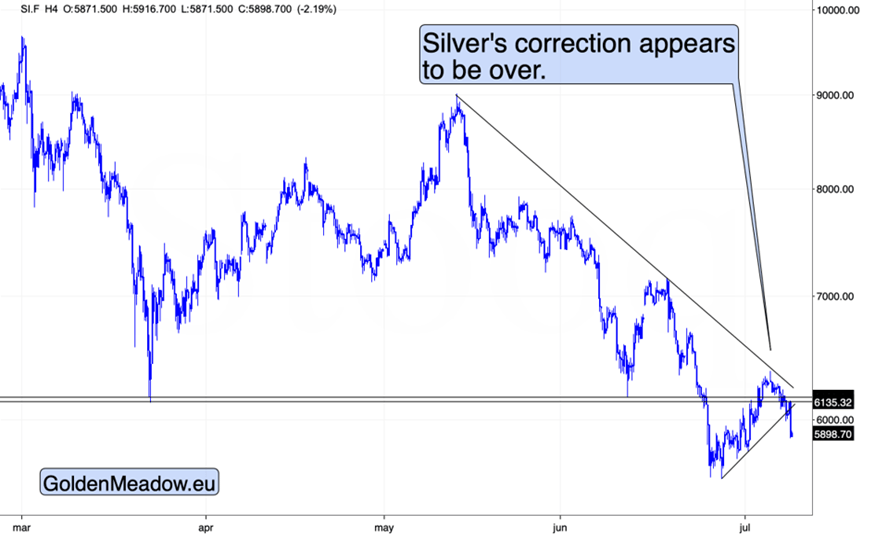
Silver price tells the story with the volume turned up. On a morning built for an inflation hedge to soar, the metal that should lead any such move is instead leading the sector down, off nearly 4%. That is not a market coiling for a launch. It is the highest-beta corner of the sector, doing what it does when the real trend is down, falling faster than everything around it.
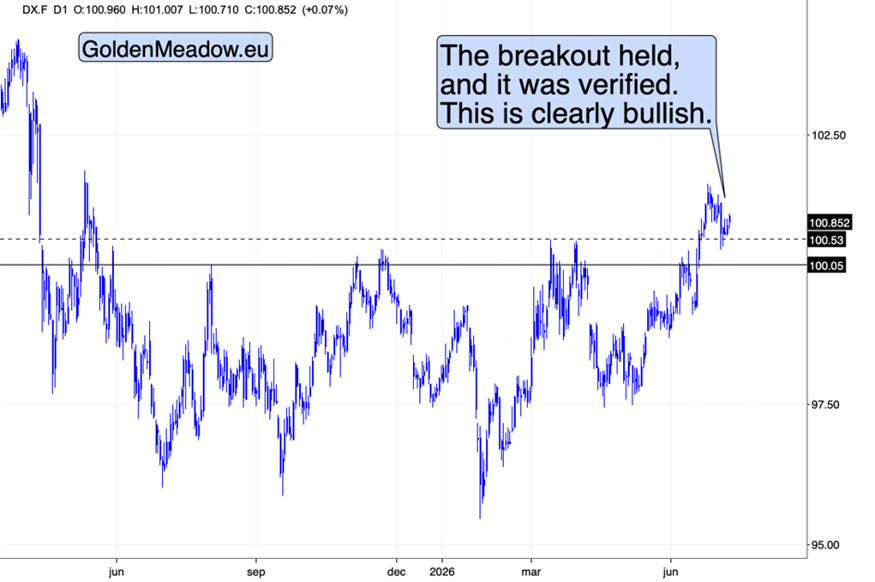
The Dollar verifies historic breakout
The dollar barely moved today (the move back up after reaching the previous highs is notable, though), and it did not need to. It broke above 100, verified that breakout last week, and it is holding while the metals break. Every failed rally in gold and every fresh low in silver is another vote for the same outcome. The chart has not changed. What changed today is that the market ran the hardest test there is, and the dollar passed.
I owe you one honest caveat, because an oil shock does not press on gold the same way at every size. While this stays a contained flare that lifts crude by a manageable amount, the chain runs clean, from oil to inflation to a firm dollar (higher odds for rate hikes) to weaker metal, which is exactly today. If the Strait were to close outright and crude ran toward the numbers some analysts are now naming, well above $100, the shock would stop being merely inflationary and turn into something harsher, with stalling growth and financial stress in the mix. That is the setting where gold's role has flipped before, in the 1970s, once the damage grew large enough to force central banks to fight a slump instead of only prices. Nothing on today's tape is close to that, and every arrow points my way this morning, but I will keep the full-closure path in view, because it is the one road that would rewrite the script.
None of this dents the outlook. The bounce is spent, the sector is rolling over together, and it is doing so into the loudest bullish headline of the year. War came back to the Strait, oil soared, and gold sank. The market has told you, in the plainest voice it has, what truly drives it.
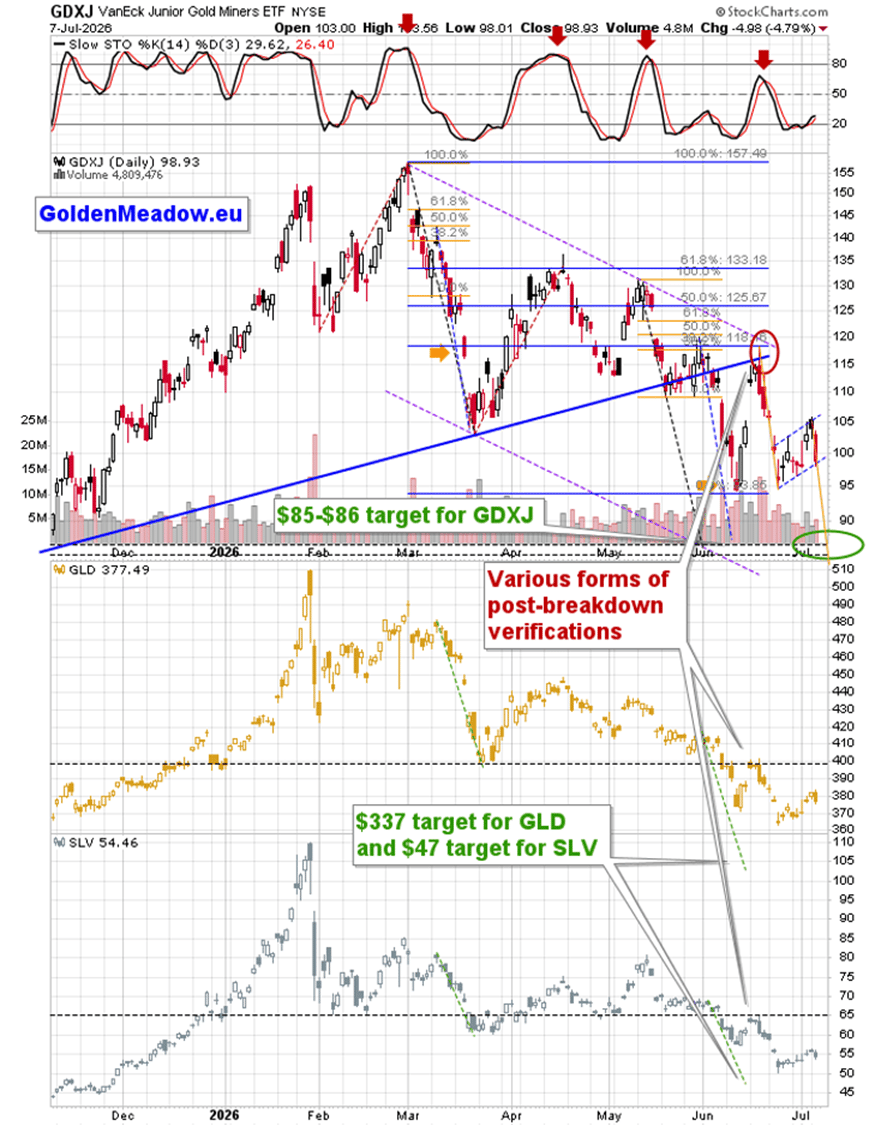
Mining stocks plunged almost 5% yesterday, and given today’s move lower in gold, the odds are that we’ll see a slide well below the flag pattern, perhaps even to new 2026 lows.
Makes one wonder why miners declined so much yesterday, even though gold moved only modestly lower then. Well, it is usually the case that mining stocks lead metals higher or – in this case – lower, but in this particular case… Perhaps someone (or more people) knew that the situation in Iran is going to get messier? The same with oil’s breakout.
You see, the “chart voodoo” also known as the technical analysis is no voodoo at all. It’s a set of rules and principles that work most of the time, but not all of the time because no situation is identical. The point is that they are based on reality, and sometimes on reality that is happening behind closed doors. If one knows where to look, they can stay on the right (legal) side of the said door, and still get a feeling of what’s likely to happen next. Just like you don’t have to be in a given room to hear what’s happening there if you’re close enough. In our case, this “being close enough” means knowing what to monitor.
Also, please note that the FCX was down substantially already yesterday, even though copper is down only today.
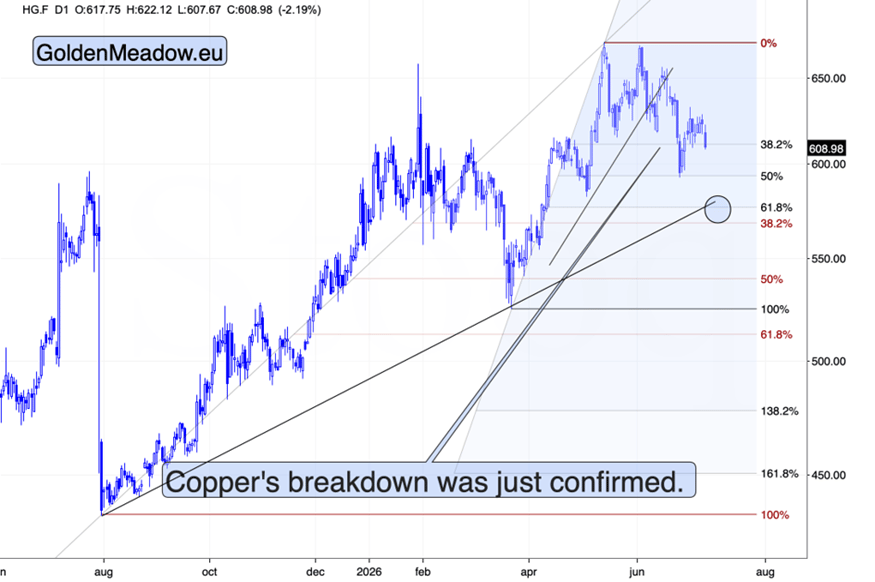
Again, those recent declines look aligned, but they are not – the stock market is not yet open, so FCX shows yesterday’s price changes, while the upper chart shows today’s pre-market decline in copper.
Different market, similar signal.
All in all, it looks like our profits are going to increase once again shortly.
As always, I will keep my subscribers informed.
Want free follow-ups to the above article and details not available to 99%+ investors? Sign up to our free newsletter today!
Author

Przemyslaw Radomski, CFA
Gold Price Forecast
Przemyslaw Radomski, CFA (PR) is a precious metals investor and analyst who takes advantage of the emotionality on the markets, and invites you to do the same. His company, Sunshine Profits, publishes analytical software that any
















