Oil trading is not for the faint of heart
- Crude oil demand estimated to be down 10% from last year.
- WTI and Brent off more than 50% in five weeks on recession and price war fears.
- History predicts a rapid return for oil prices.

The collapse of the price of crude oil over the past five weeks has been eye-watering in its speed but otherwise unremarkable in a commodity market long given to violent price movement.
Under the twin flails of a global recession as yet unrecorded in the statistics but bordering on a certainty and a price war between two of its largest producers Russian and Saudi Arabia, the price of West Texas Intermediate (WTI), the US standard has fallen 57.8% in five weeks. Over the same five weeks Brent, the international standard, lost 50.7%.
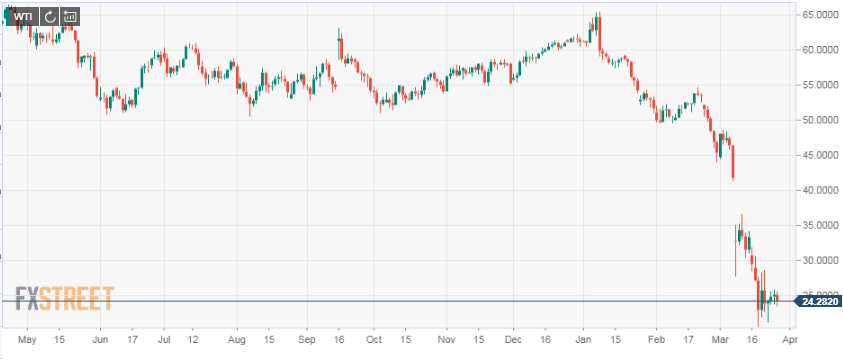
From the open of $53.50 on February 20th just as the Coronavirus was becoming the dominant news story in the United States to the close on March 26 at $22.60 WTI blew through every technical and fundamental level reaching an 18 year low of $19.46 on March 20.
Oil markets are terrified that the worldwide Coronavirus pandemic will plunge the global economy into recession, instigating a demand shock of historic proportions.
OPEC and Russia
Earlier in the month OPEC and Russia the so-called OPEC+ group failed to agree on extending oil production cuts which expire on April 1. Even though these supply agreements were largely ineffective in raising crude prices the disagreement within the group has led Saudi Arabia and the United Arab Emirates to threaten increased production, a warning answered by Russia with her own promise to ramp up pumping. Both countries are heavily dependent on oil revenues for their national budgets.
Crude demand
Analysts estimate that demand for crude has fallen more than 10% or 10 million barrels a day from the 2019 average. The potential for even more supply entering the market has kept oil on the defensive even as equity market in the US have jumped 18% in the last three sessions.
China’s economy has slowly started to recover after four months of pain but the rest of the world is much earlier in the pandemic and there is no guarantee that the prognosis in Europe and the United States will match that of the mainland.
Crude oil economics
Crude oil is the industrial world’s most basic commodity. Almost every factory product is touched by the price of oil. It is a feedstock for myriad set of everyday and industrial goods, its energy powers electricity generation and factories the world over and gasoline, jet fuel and diesel run transportation on every continent.
All of those costs will be improved by the decline in energy prices. For consumers the reduction in gasoline will add disposable income to the household budget at a crucial moment.
Against these benefits are the damage to the profits of oil companies and refineries, the loss of jobs in the oil fields and allied industries and the potential bankruptcy of thousands of shale operators in the United States in Canada.
For a global economy facing the most rapid recession in history the oil price decline may help cushion the blow.
Crude oil price history
Though the almost 60% drop in the price in a barrel of WTI over the past five weeks has been remarkable it is only one of a series of huge price swings in the past twelve years.
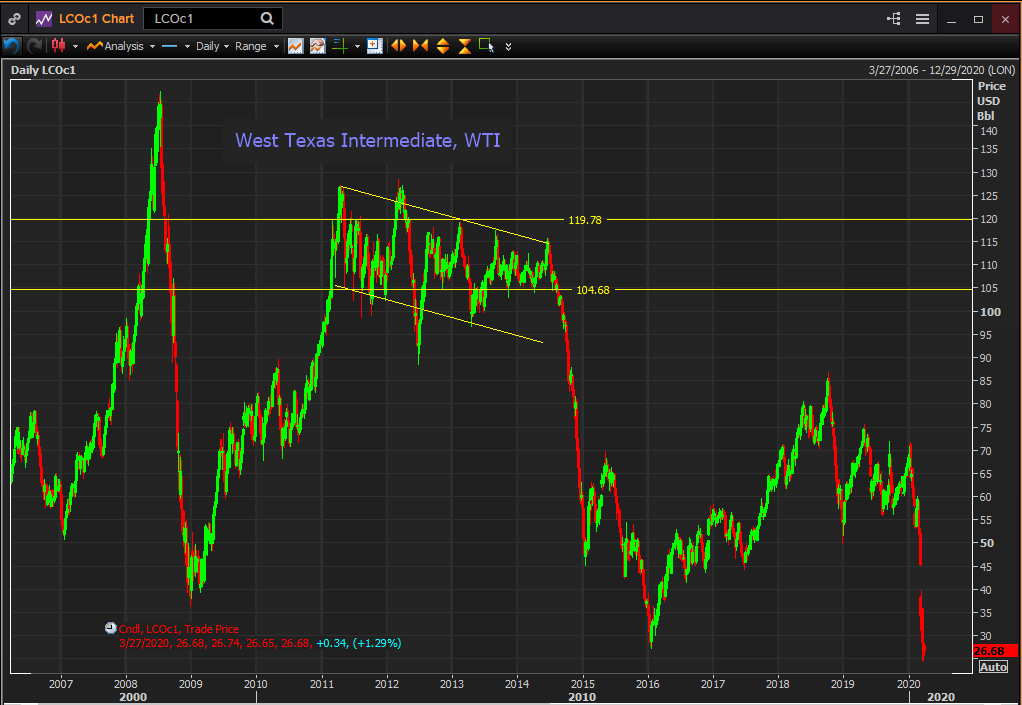
In 2018 WTI dropped from $75.12 in early October to $42.36 three months later in December for a loss of 43.6%. In late 2014 and the first half of 2015 WTI shed 59.2% in seven months from $106.71 in the last week of June to $43.58 in late January 2015.
And finally the all-time champion of crude declines the 77.1% plummet from $141.59 in July 2008 to $32.40 four-and-a-half months later in mid-December.
In each case prices recovered though the amount of the return and the timeframe varied substantially.
After the bottom in December 2009 at $32.40 it took 16 months to April 2010 to get back to $85 and a further year to reach $125. Following the low in January 2015 at $43.58 the recoup to $66.81 lasted until that May. And after the December 2018 low of $42.36 by April WTI was back to $74.04.
The longest period of relative price stability for crude was between February 2011 and September 2014 featuring an absolute range of $89.23 to $126.20 and a functional trading range, with four prominent exceptions, of $120 to $105.
Despite the recession fears coursing through the markets and the yet unknown climax of the Coronavirus crisis, we can be sure and price history tells us that oil will not stay at its current level for very long.
Author

Joseph Trevisani
FXStreet
Joseph Trevisani began his thirty-year career in the financial markets at Credit Suisse in New York and Singapore where he worked for 12 years as an interbank currency trader and trading desk manager.


