Oil prices are poor predictors of recession
- Crude price movement before last five recessions are ambivalent.
- WTI has fallen 66% since January 7 to its lowest price in 18 years.
- Previous sharp drops in oil did not anticipate downturns.

In the last four decades crude oil price movement in the half year before a recession shows little indication the commodity anticipated the coming slowdown.
The National Bureau of Economic Research (NBER) is a private nonprofit research organization that has dated the start and end of US recessions going back to 1857. Its data has become the standard definition of American economic cycles.
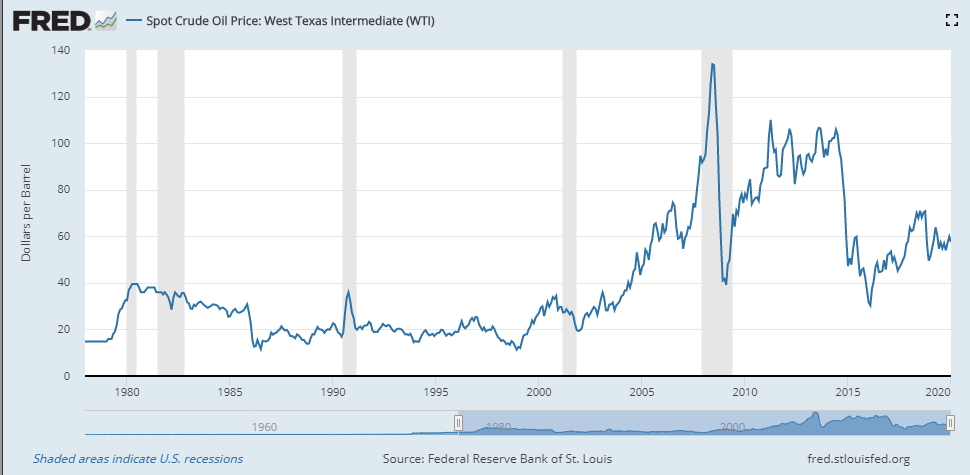
NBER recessions and WTI
Of the five recessions the US has experienced going back to 1980, two saw price increases in the half-year prior to the onset and three witnessed declines. In the 1980 recession which began in January and lasted to July, the price for a barrel of West Texas Intermediate (WTI) the US price standard, rose 70.1% from an average of $19.10 in July 1979 to $32.50 in the first month of the downturn.
In the six months prior to second part of what is considered a double-dip recession that started in July 1981 and extended to November 1982, WTI prices fell 5.3%, from $38 in January to $36.
In the next two brief recessions prices moved substantially lower. For the July 1990-March1991 eight month decline WTI dropped 17.7%, from $22.64 to $18.64. For the March to November 2001 recession, also eight months long, prices had fallen 19.6% in the previous half-year from $33.88 to $27.24.
The 2007-2009 recession had been running almost a year before the financial crash in the late quarter of 2008 enveloped the economy. In the six months prior to the start of the downturn in December 2007 WTI had climbed 23.7% from $74.18 to $91.73.
In two of the five recessions WTI prices rose in the first half of the downturn before reversing lower. In 1990 crude rose from $18.64 in July, the first month in the NBER accounting, rose to $35.92 in October. In 2007 WTI soared from $74.18 in December to an average price of $133.93 in June 2008 and then plummeted as the financial crisis entered its obvious manifestation stage.
In three of the above five recessions 1981-82, 2001 and 2007-2009 prices at the finish of the recession were lower than at the start and in 1980 and 1990-1991 they ended higher.
Crude prices in 2020
The 65.9% drop in WTI this year is not the largest price decline on record. That distinction belongs to the 77.1% plunge from $141.59 (daily close) in July 2008 to $32.40 four-and-a-half months later in mid-December. But it is now the second largest decline followed by 59.2% in the last half of 2014 and 43.6% from October 2018 to December. In order for the current crude price decline to break to an all-time record WTI would have to fall below $14.83.
WTI
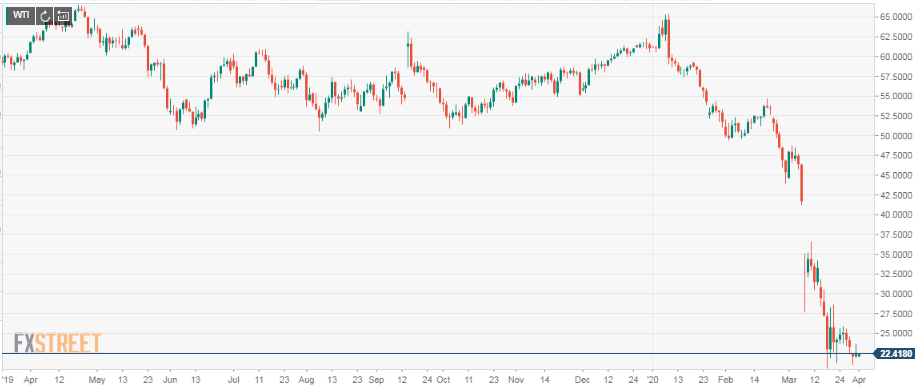
The collapse in crude prices this year was, until late February, largely a response to the anticipated slowdown in the global economy and oil demand from the economic shutdown in China. Just as the run up prices from October to January was speculation on the success of the US-China trade agreement.
The global spread of the virus and the domestic economic closures that are the main method of dealing with its eruption are expected to wreck demand for crude by an extraordinary amount. But the plunge in crude oil since January is coincident to the universally anticipated global recession not its forerunner.
Author

Joseph Trevisani
FXStreet
Joseph Trevisani began his thirty-year career in the financial markets at Credit Suisse in New York and Singapore where he worked for 12 years as an interbank currency trader and trading desk manager.


