Oil outlook: President-elect Trump and Oil

Oil prices moved lower yesterday. Today we are to take a look at the US elections, the impact of Hurricane Rafael, discuss the possibility of reduced oil demand from China and OPEC+’s oil production cut extension. We are to conclude the report with a technical analysis of WTI’s daily chart.
Donald J Trump the 47th President of the USA
The US Presidential elections have now concluded, with a clear victor having emerged on Wednesday. Specifically, Donald J Trump is now President-elect with his Inauguration set to occur on the 20th of January 2025. Nonetheless, we now look towards Trump’s policies and in particular the comments made in regards to bringing energy prices down, as the incoming administration’s policies may impact oil prices. In particular, the President-Elect has vowed to unleash the US’s energy dominance by streamlining permits and ending restrictions on oil, natural gas, and coal which in turn could allow energy firms in the US to vastly increase oil production levels and thus by increasing the supply of the liquid gold, oil prices may decrease. Moreover, with the Republicans set to control the Senate and potentially the House of Representatives, any legislation in favour of increasing oil production levels and permits brought forth by the incoming administration may meet little to no resistance before being signed into law. In turn, this may aggravate the bearish effect on oil prices should the Republicans manage to secure the trifecta. On the flip side, should the Democrats manage to take over the House, it may have the opposite effect and could instead aid oil prices in the short term.
Hurricane Rafael
Hurricane Rafael at the time of this report is a category two hurricane and has entered the Gulf of Mexico after passing over Cuba. The Hurricane could potentially disrupt oil production in the Gulf of Mexico up until next Tuesday. In turn market worries about a possible disruption of oil production in the region, may have mitigated some of the downward pressures exerted on oil’s price since the US elections. Furthermore, some storm tracking websites have identified another potential disturbance in the area, with “Zoom Earth” claiming a 20% probability of the disturbance developing into a tropical depression or tropical storm in the next two days. Nonetheless, should further Hurricanes form in the region, which may threaten the oil production of the region, we may see supply chain concerns translating into support for oil prices.
Slack in Chinese Oil demand
According to a recent report by Bloomberg, oil imports in China have decreased once again during the month of October. In particular, imports contracted to 44.7 million tons in October, which would be 2% lower than the figure in September and when compared to last year’s data for the same month, it would be 9% lower. Overall, it appears that the slack in demand from the world’s largest oil consumer may be worrying for the longer-term demand for oil. Thus, should concerns about oil consumption from China further intensify we may see downward pressures being exerted on oil prices.
OPEC+ extends voluntary Oil production cuts
According to a press communique by the OPEC Secretariat, the eight OPEC+ countries which include Saudi Arabia, Russia, Iraq, the UAE, Kuwait, Kazakhstan, Algeria, and Oman have agreed to extend their 2.2 million barrels per day voluntary oil production cut, up until December 2024. The announcement that the oil cartel has decided to extend its voluntary oil production cuts by one month, is not necessarily that much of a surprise as oil prices have faced difficulty in breaking above the $80 dollar per barrel mark in the past few months. Nonetheless, the announcement may have provided some support for oil prices, yet when the cartel does decide to unwind the voluntary cuts, it may exert downwards pressures on oil prices.
Technical analysis
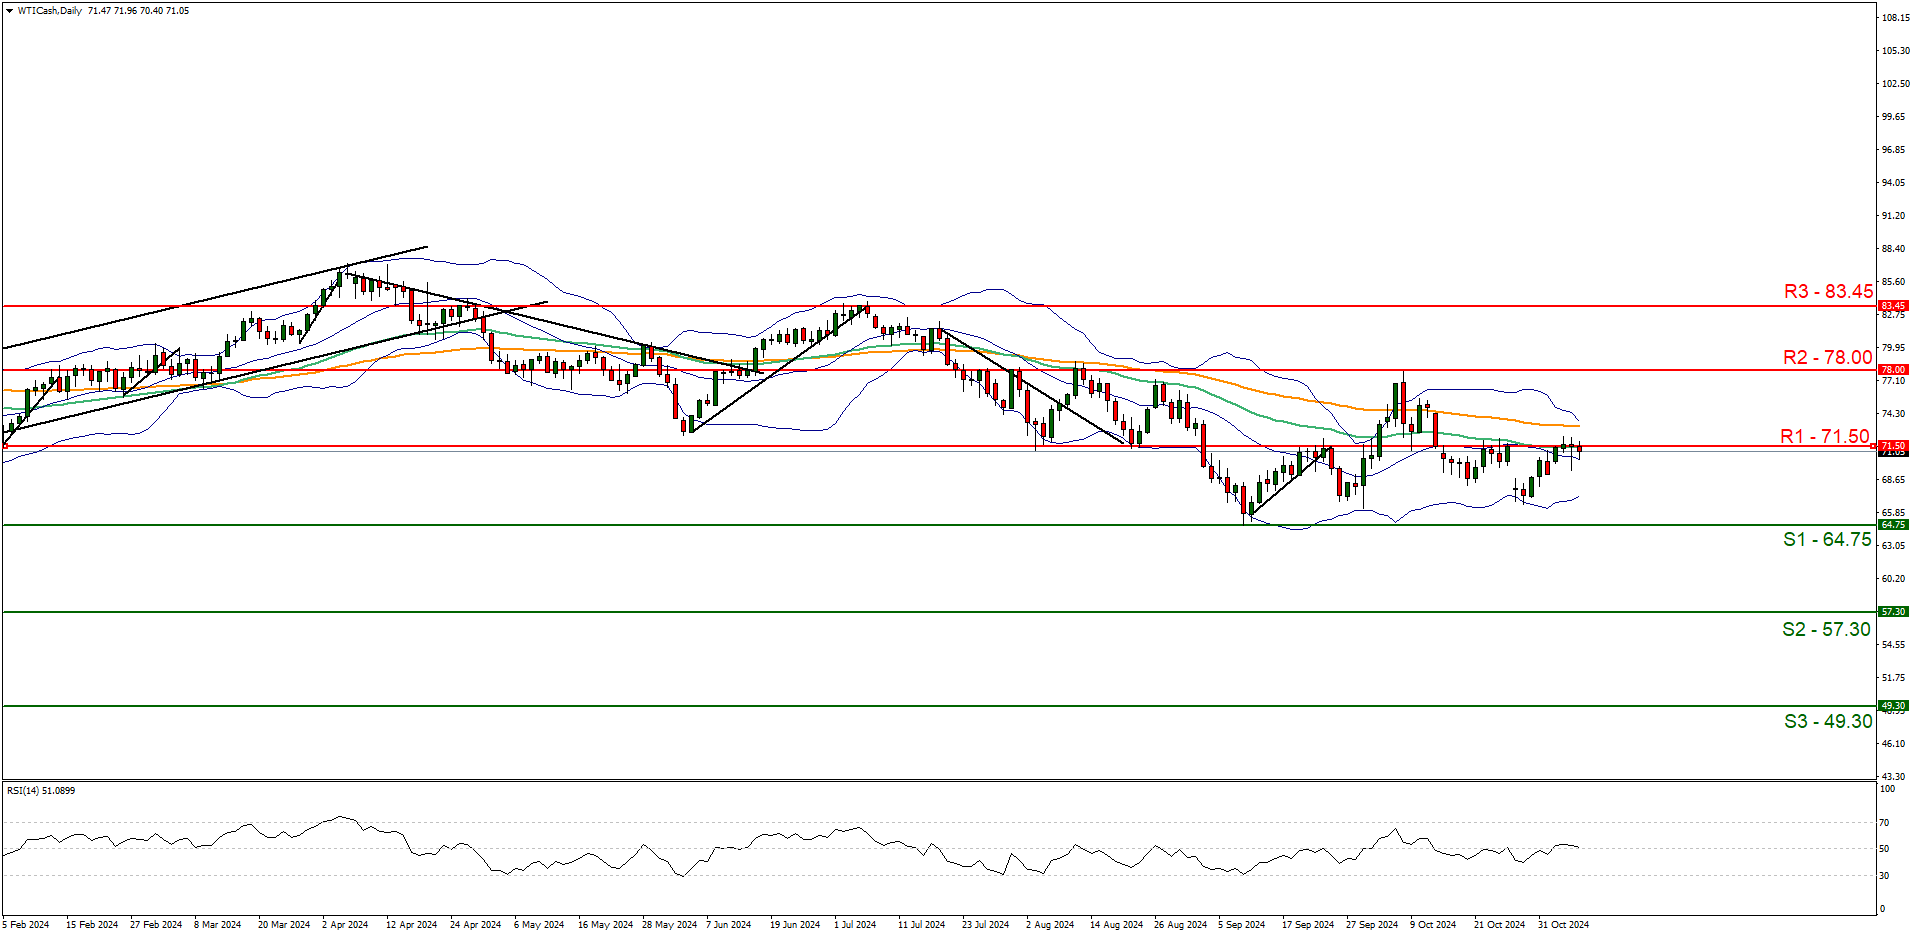
WTI Cash daily chart
Support: 64.75 (S1), 57.30 (S2), 49.30 (S3).
Resistance: 71.50 (R1), 78.00 (R2), 83.45 (R3).
WTI’s price action edged lower after failing to clearly break above our 71.50 (R1) resistance level. We opt for a sideways bias for the commodity and supporting our case is the RSI indicator below our chart which currently registers a figure of 50, implying a neutral market sentiment. For our sideways bias to continue, we would require the commodity’s price to remain confined between the 64.75 (S1) support level and the 71.50 (R1) resistance line. On the flip side for a bearish outlook, we would require a clear break below the 64.75 (S1) support level, with the next possible target for the bears being the 57.30 (S2) support line. Lastly, for a bullish outlook we would require a clear break above the 71.50 (R1) resistance line with the next possible target for the bulls being the 78.00 (R2) resistance level.
Author

Phaedros Pantelides
IronFX
Mr Pantelides has graduated from the University of Reading with a degree in BSc Business Economics, where he discovered his passion for trading and analyzing global geopolitics.


