|

OIL (CL #F) Forecasting The Rally & Buying The Dips

Hello fellow traders. In this technical blog we're going to take a quick look at the past Elliott Wave charts of OIL (CL #F) published in members area of www.elliottwave-forecast.com. We're going to explain the Elliott Wave forecast and our trading strategy. As our members know , we were keep saying that OIL is trading within larger bullish trend. It was showing incomplete bullish sequences in the h4 and daily cycles as presented in Sequence Report. Consequently , we advised our members to avoid selling it,and keep buying the dips in 3,7,11 swings when get chance.

Let's take a look at the previous short term Elliott Wave forecasts.

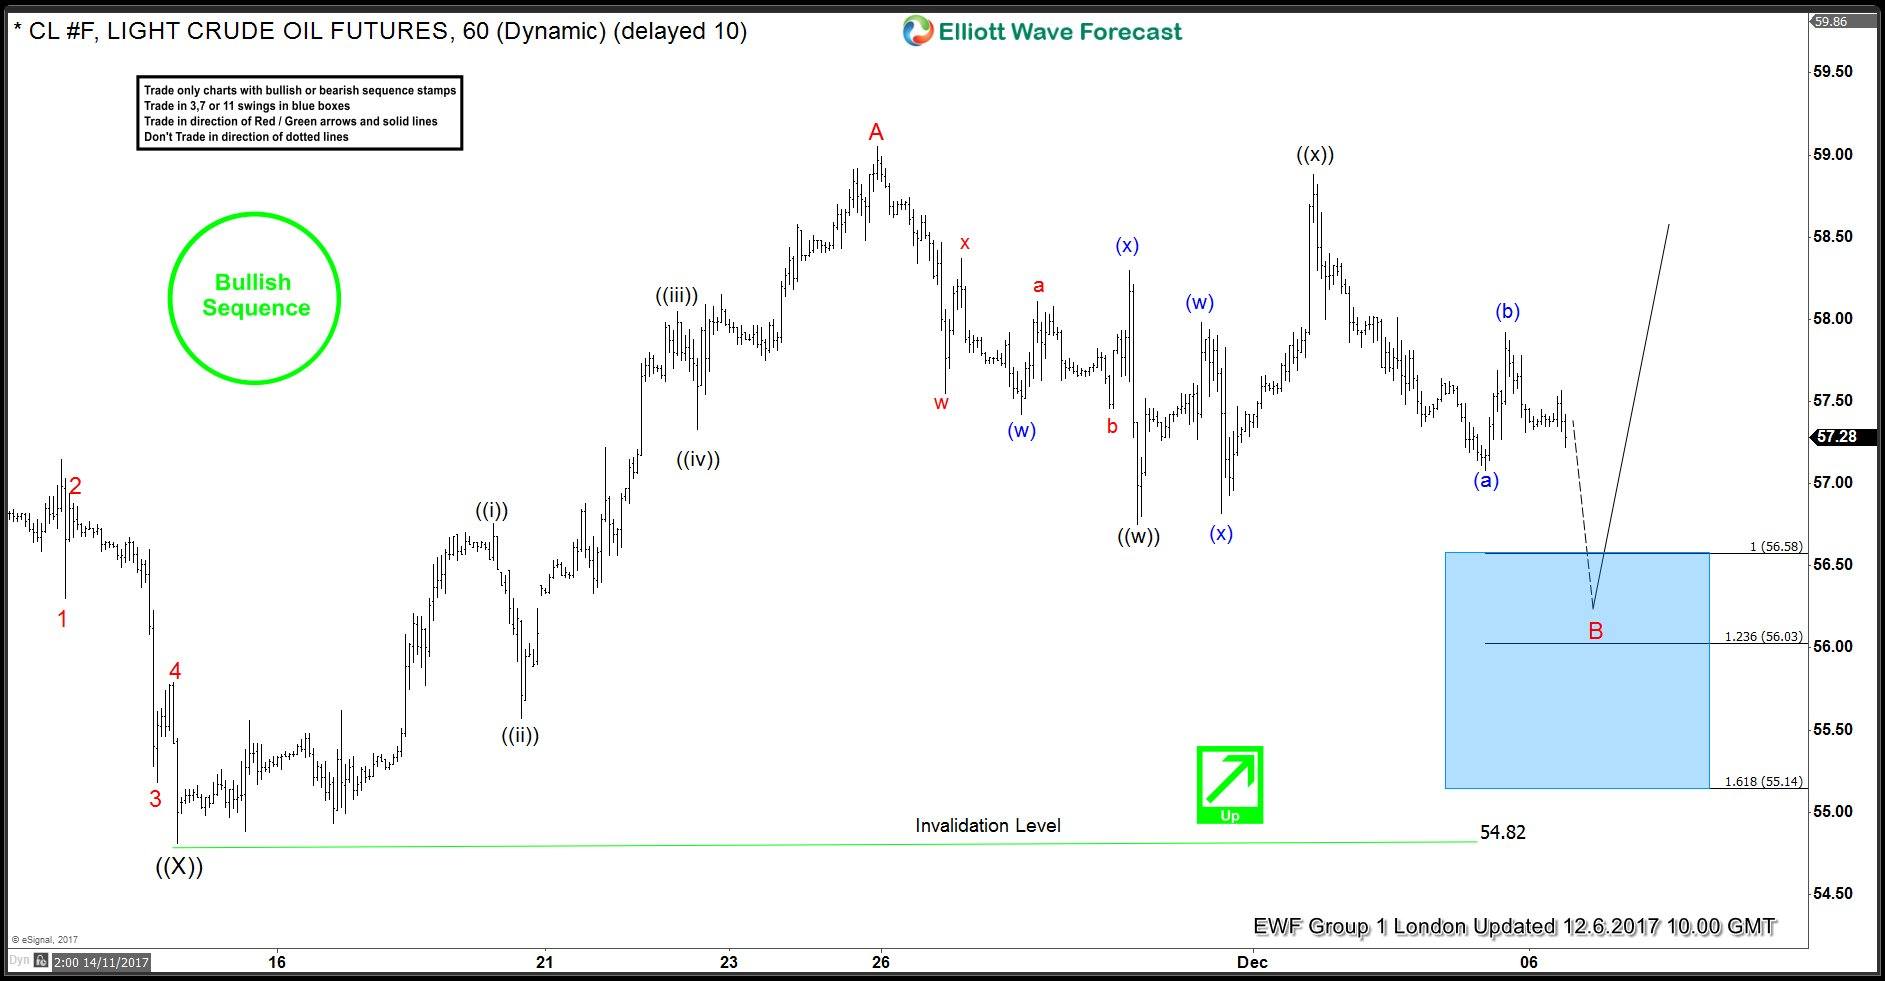
OIL 1 hour London update 12.06.2017

As we can see on the charts bellow, wave B red pull back is in progress, correcting the cycle from the 54.82 low. Proposed pull back is unfolding as Double Three structure ((w))((x))((y)), when we're in ((y)) leg. More precisely in wave (c) of ((y)). Current view is suggesting more short term wekness in order to complete 7 swings structure. Although the pair is expected to trade lower in short term, we don't recommend selling it against the main bullish trend. We're looking for 56.58-56.03 area where we would like to be buyers. Invalidation for the long positon is break below 1.618 Fibonacci extension : 55.14 level or break of 54.82 pivot.

Oil

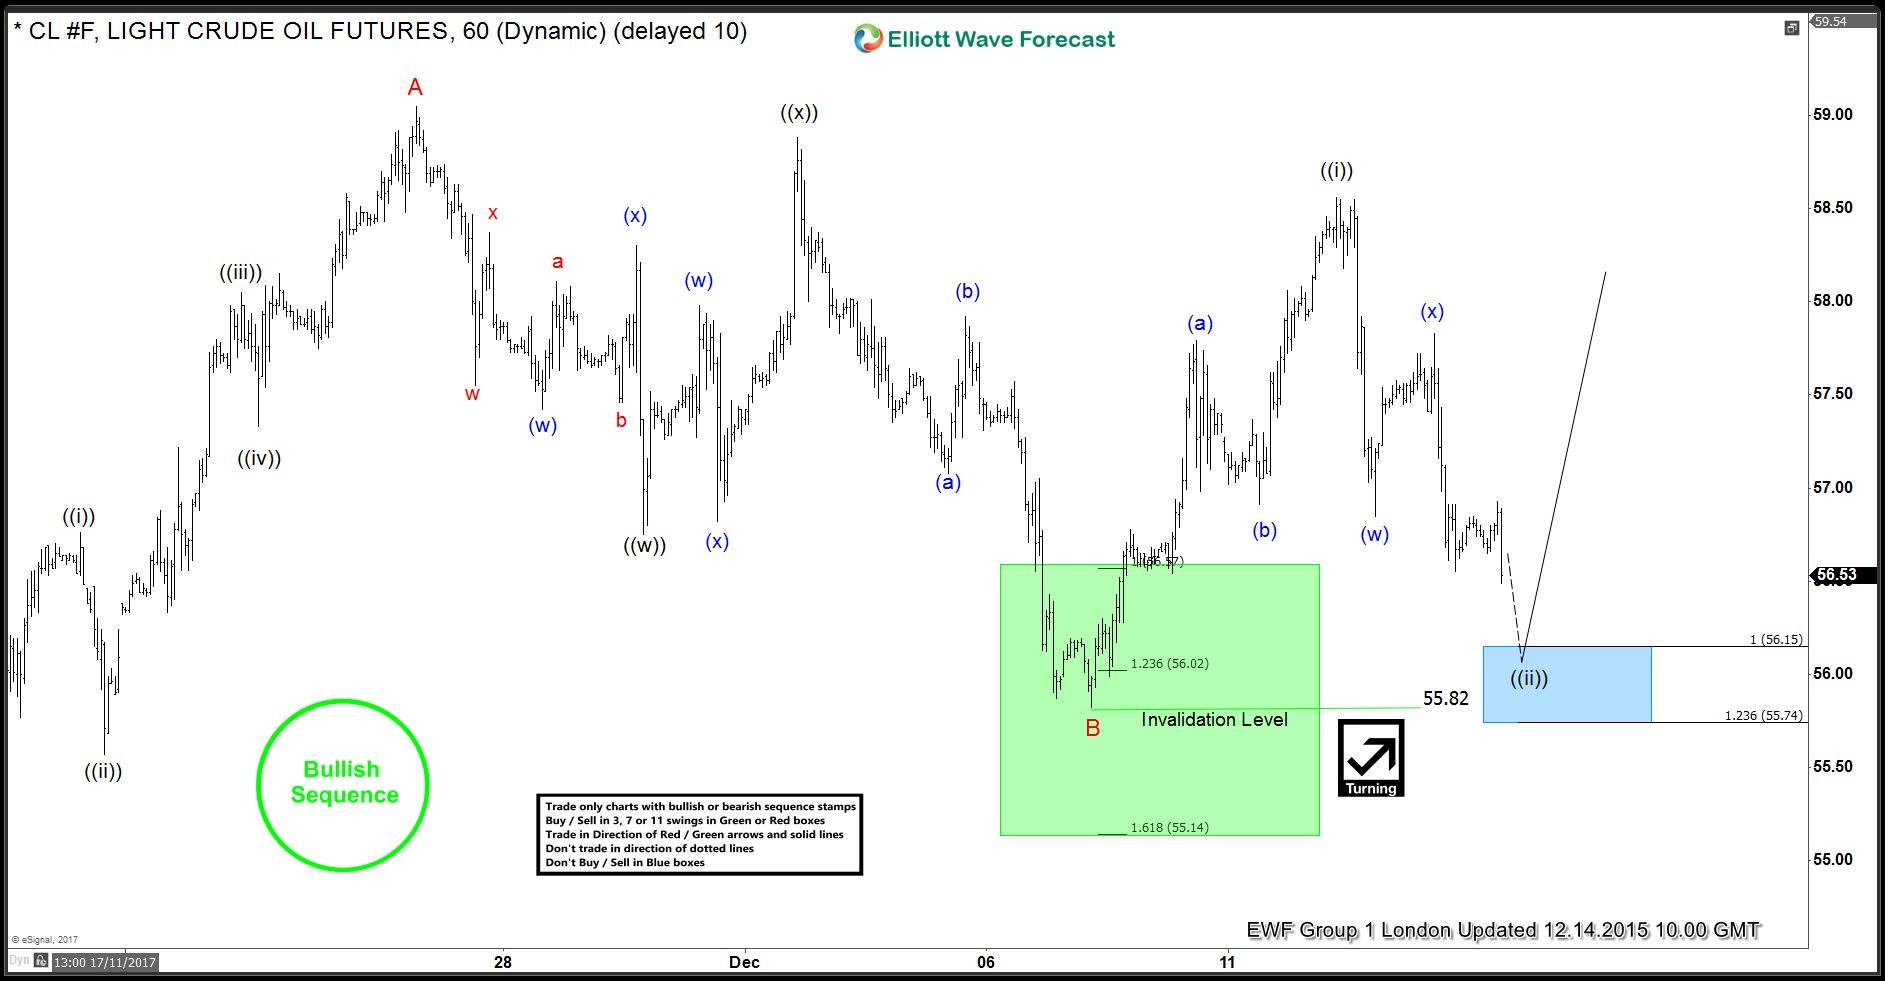
OIL 1 hour London update 12.14.2017

Eventually OIL has made proposed push lower toward our buying zone at 56.58-56.03. Sellers were strong enough to break little bit below 1.236 Fibonacci extension level:56.02, however buyers appeared immediately and the price has made nice rally from there. We're calling pull back B red completed at 55.82 low and expecting it to hold for further rally ideally. Long positions are already risk free.

Oil

Become a Successful Trader and Master Elliott Wave like a Pro. Start your Free 14 Day Trial at - Elliott Wave Forecast.

Author

Elliott Wave Forecast Team

Elliott Wave Forecast Team

ElliottWave-Forecast.com

More from Elliott Wave Forecast Team
Share:

Editor's Picks

EUR/USD off highs, back to 1.1850

EUR/USD loses some upside momentum, returning to the 1.1850 region amid humble losses. The pair’s slight decline comes against the backdrop of a marginal advance in the US Dollar as investors continue to assess the latest US CPI readings.

GBP/USD advances to daily tops around 1.3650

GBP/USD now manages to pick up extra pace, clinching daily highs around 1.3650 and leaving behind three consecutive daily pullbacks on Friday. Cable’s improved sentiment comes on the back of the inconclusive price action of the Greenback, while recent hawkish comments from the BoE’s Pill also collaborates with the uptick.

Gold surpasses $5,000/oz, daily highs

Gold is reclaiming part of the ground lost on Wednesday’s marked decline, as bargain-hunters keep piling up and lifting prices past the key $5,000 per troy ounce. The yellow metal’s upside is also propped up by the lack of clear direction around the US Dollar post-US CPI release.

Crypto Today: Bitcoin, Ethereum, XRP in choppy price action, weighed down by falling institutional interest 

Bitcoin's upside remains largely constrained amid weak technicals and declining institutional interest. Ethereum trades sideways above $1,900 support with the upside capped below $2,000 amid ETF outflows.

Week ahead – Data blitz, Fed Minutes and RBNZ decision in the spotlight

US GDP and PCE inflation are main highlights, plus the Fed minutes. UK and Japan have busy calendars too with focus on CPI. Flash PMIs for February will also be doing the rounds. RBNZ meets, is unlikely to follow RBA’s hawkish path.

Ripple Price Forecast: XRP potential bottom could be in sight

Ripple edges up above the intraday low of $1.35 at the time of writing on Friday amid mixed price actions across the crypto market. The remittance token failed to hold support at $1.40 the previous day, reflecting risk-off sentiment amid a decline in retail and institutional sentiment.