NZD/USD Elliott Wave technical analysis [Video]
![NZD/USD Elliott Wave technical analysis [Video]](https://editorial.fxsstatic.com/images/i/NZDUSD-bearish-object.png)
NZD/USD Elliott Wave technical analysis – Day chart
Function: Trend.
Mode: Impulsive.
Structure: Orange Wave 3.
Position: Navy Blue Wave 1.
Direction of higher degrees: Orange Wave 3 (Initiated).
Details: The correction in Orange Wave 2 appears complete; Orange Wave 3 is now active.
Wave cancel invalid level: 0.58854.

The NZDUSD daily chart presents a clear trend with an impulsive wave structure developing. Currently, Orange Wave 3 is progressing within a broader Navy Blue Wave 1 structure. This indicates that the pair is in the early stages of a strong Elliott Wave sequence, typically associated with increased price momentum. Technical indicators confirm that Orange Wave 2 has finished, and price action has now transitioned into Orange Wave 3 — known for its forceful moves in trending markets.
The impulsive behavior is marked by continuous higher highs, signaling strong institutional demand. This setup, occurring within Navy Blue Wave 1, suggests the pair may be at the beginning of a broader bullish cycle, with Orange Wave 3 offering notable upside potential. The wave invalidation level is set at 0.58854, which is critical for preserving the current bullish structure — any movement below this would call for a reassessment of the count.
This analysis reflects a strong and expanding trend, with potential for continued gains before reaching resistance. The transition from a correction to impulse confirms a positive shift in sentiment, opening up promising trading opportunities. Traders should closely observe Orange Wave 3, as this wave often delivers the sharpest movements in Elliott Wave sequences.
Maintaining the bullish outlook depends on price staying above the 0.58854 invalidation level. This serves as a key reference for risk management. With demand still strong, the trend environment supports favorable trading conditions. The daily chart aligns with multi-timeframe strength, offering traders high-probability setups within the trend, along with a structured approach to manage risk effectively.
NZD/USD Elliott Wave technical analysis – Four-hour chart
Function: Trend.
Mode: Impulsive.
Structure: Orange Wave 3.
Position: Navy Blue Wave 1.
Direction of higher degrees: Orange Wave 3 (Initiated).
Details: Orange Wave 2 appears completed. Orange Wave 3 is now in motion.
Wave cancel invalid level: 0.58854.
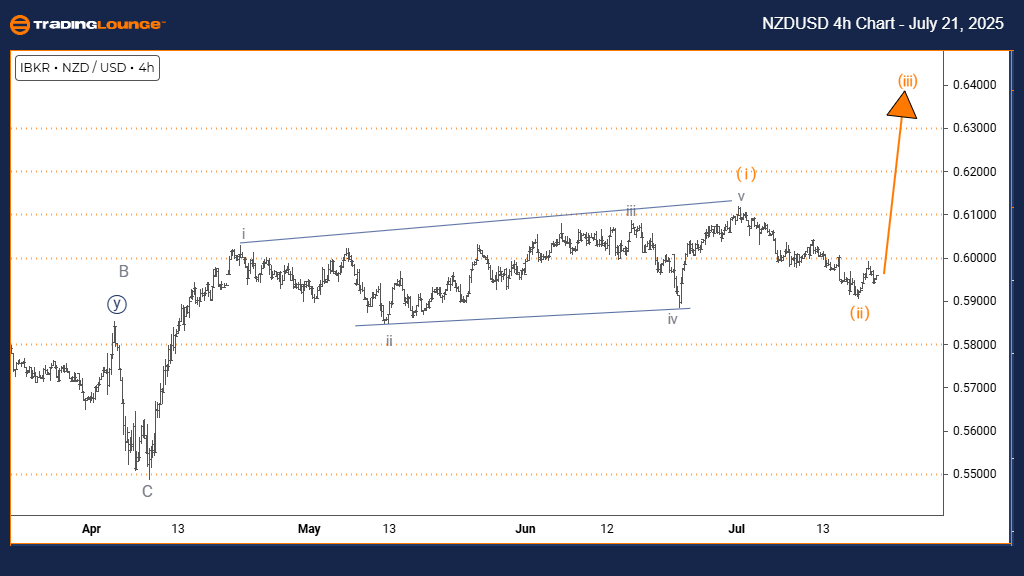
The 4-hour Elliott Wave analysis of NZDUSD identifies a strong trend with a clear impulsive structure. Orange Wave 3 is developing within a larger Navy Blue Wave 1 framework. This setup places the currency pair in what is generally the most active and extended stage of the Elliott Wave sequence. Technical data confirms the end of the corrective Orange Wave 2, and price action has now moved into Orange Wave 3, historically known for its strength and momentum.
This impulsive behavior is characterized by consistent higher highs, pointing to continuous buying interest. Within the structure of Navy Blue Wave 1, Orange Wave 3 typically provides the initial surge in a broader uptrend. The invalidation level is set at 0.58854. If breached, the current bullish wave count would no longer be valid.
The current setup confirms that NZDUSD has moved out of its corrective phase and into a decisive bullish cycle. This third wave phase is where most notable price expansions often occur. The 4-hour time frame reinforces this view, offering actionable insights for short-term traders. Observing the progression of Orange Wave 3 is essential, as it can provide signals for continued upward momentum. The 0.58854 level remains the key technical reference for maintaining wave validity.
Analysis suggests the bullish structure remains intact and poised to extend further, especially after minor pullbacks. The third wave environment generally presents high-probability, risk-adjusted trade setups. Traders can structure their strategies to align with the upward trend while applying disciplined risk control based on the invalidation level. Strong demand and market interest support the current upward trajectory, with additional gains likely before any major resistance zones are tested.
NZD/USD Elliott Wave technical analysis [Video]
Author

Peter Mathers
TradingLounge
Peter Mathers started actively trading in 1982. He began his career at Hoei and Shoin, a Japanese futures trading company.


