NZD/USD Elliott Wave technical analysis [Video]
![NZD/USD Elliott Wave technical analysis [Video]](https://editorial.fxsstatic.com/images/i/NZDUSD-bearish-object_XtraLarge.png)
NZD/USD Elliott Wave technical analysis
Function: Counter Trend.
Mode: Corrective.
Structure: Orange Wave 2.
Position: Navy Blue Wave 1.
Direction next higher degrees: Orange Wave 3.
Details: Orange Wave 1 appears complete, with Orange Wave 2 currently developing.
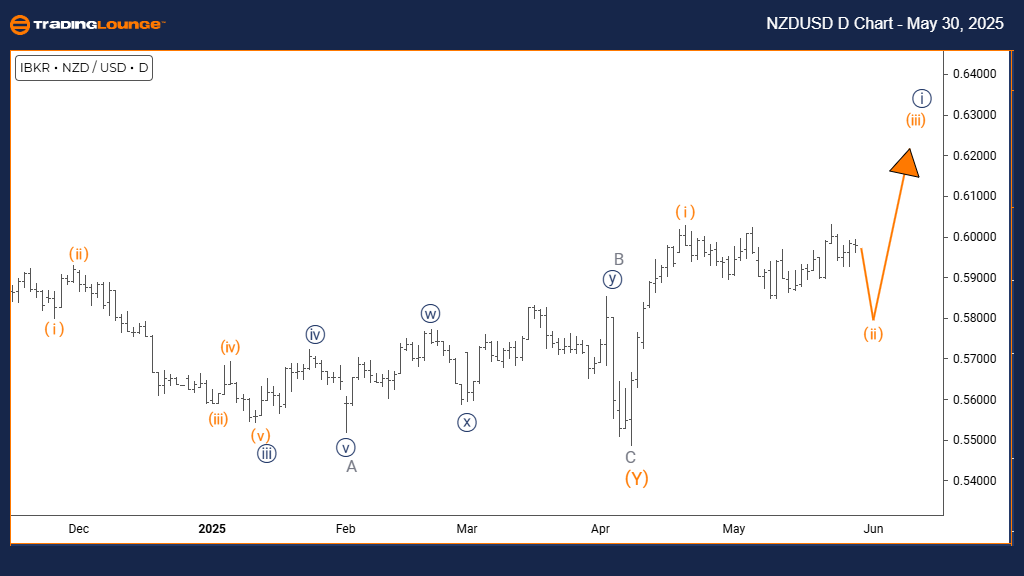
The daily chart analysis identifies NZDUSD in a corrective counter-trend phase, forming part of a larger bearish sequence marked as Navy Blue Wave 1. The chart reflects that Orange Wave 1 has likely concluded, leading into Orange Wave 2—a temporary upside correction within a broader downtrend.
This setup typically represents a brief pause before the larger bearish move resumes. The technical scenario supports a continuation of the downtrend via Orange Wave 3, assuming key resistance levels remain intact.
The corrective movement of Orange Wave 2 implies limited upside and heightened volatility. Traders should watch for signals that Orange Wave 2 is ending, as this would likely mark the start of Orange Wave 3’s downward thrust. This phase provides a potential short-term trading opportunity within a bigger bearish cycle.
Traders must stay cautious and assess price action for clearer wave structure signals. The ongoing upward movement is part of a larger correction rather than the beginning of a new uptrend. Disciplined risk management remains crucial, as the market may soon return to its downward trajectory upon completing this correction.
NZD/USD – Day chart
NZD/USD Elliott Wave technical analysis
Function: Counter Trend.
Mode: Impulsive as C.
Structure: Gray Wave C.
Position: Orange Wave 2.
Direction next higher degrees: Orange Wave 3.
Details: Gray Wave B appears complete; Gray Wave C of Wave 2 is now in progress.
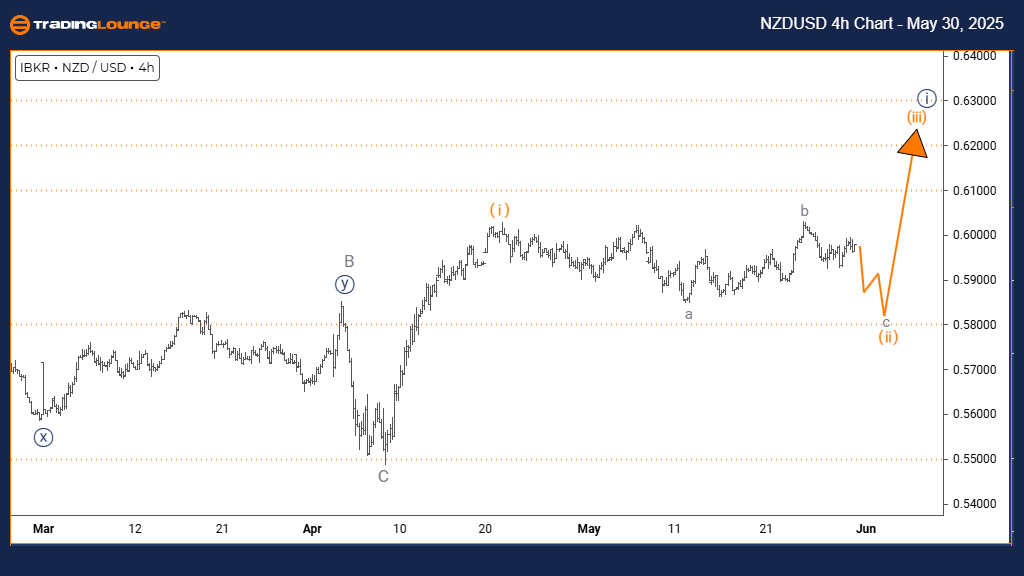
The 4-hour chart analysis positions NZDUSD in a counter-trend scenario with an impulsive move forming within a corrective wave structure. Gray Wave C is developing as part of Orange Wave 2, with Gray Wave B having completed its upward retracement. The pair now appears to be in the final downward move of the correction before a potential trend reversal.
The impulsive nature of Gray Wave C signals strong selling momentum, though it remains corrective rather than a new primary downtrend. This phase forms part of a broader setup that anticipates the eventual start of Orange Wave 3 to the upside, offering traders a clear technical map.
This structure suggests further short-term weakness as Gray Wave C unfolds. However, this decline is expected to remain bounded within the corrective cycle. Watching for signs of completion in Wave C will help traders prepare for the shift toward a bullish Wave 3. The setup helps identify possible reversal points and manage trades within this unfolding correction.
This Elliott Wave perspective provides a structured view of both the current downside and the corrective nature of the move. Traders should stay alert to confirmation signals marking the end of this wave and the likely continuation of the broader bullish trend.
NZD/USD – Four-hour chart
NZD/USD Elliott Wave technical analysis [Video]
Author

Peter Mathers
TradingLounge
Peter Mathers started actively trading in 1982. He began his career at Hoei and Shoin, a Japanese futures trading company.


