NZD/USD Elliott Wave technical analysis [Video]
![NZD/USD Elliott Wave technical analysis [Video]](https://editorial.fxsstatic.com/images/i/NZDUSD-bullish-animal_XtraLarge.png)
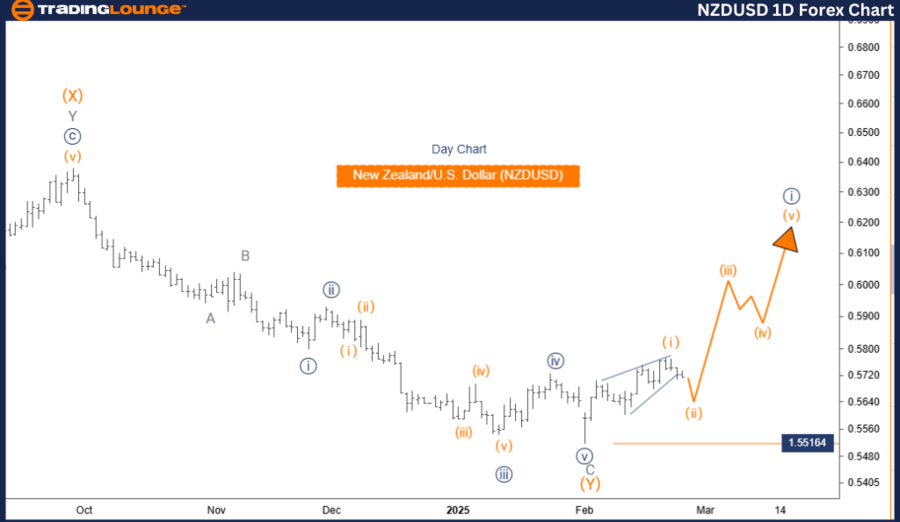
NZDUSD Elliott Wave Analysis – Trading Lounge.
New Zealand Dollar / U.S. Dollar (NZDUSD) – Day Chart.
NZD/USD Elliott Wave technical analysis
-
Function: Counter Trend.
-
Mode: Corrective.
-
Structure: Orange Wave 2.
-
Position: Navy Blue Wave 3.
-
Direction next higher degrees: Orange Wave 3.
-
Wave cancel invalid level: 0.55164.
Analysis details
The NZDUSD Elliott Wave Analysis for the day chart presents a counter-trend scenario, indicating a corrective phase within the market structure.
Currently, the market is identified as being in Orange Wave 2, which forms part of a larger corrective pattern. This Orange Wave 2 is within Navy Blue Wave 3, suggesting that the market is in an intermediate corrective phase before resuming the broader trend.
The next higher-degree movement expected is Orange Wave 3, which will likely begin after the completion of the current corrective phase.
Key observations
-
Orange Wave 1 appears to be completed, and the market is now transitioning into Orange Wave 2.
-
Wave 2 is expected to exhibit corrective characteristics, potentially including sideways or downward movements before the next impulsive wave (Orange Wave 3) begins.
-
The completion of Orange Wave 2 is critical for traders, as it signals the potential start of Orange Wave 3, which could drive the market in the direction of the larger trend.
Key level to watch
-
Wave Cancellation Invalid Level: 0.55164
-
If the price moves above this level, the current wave count becomes invalid, requiring a reassessment of the market structure.
-
This level acts as key resistance, and if breached, it may indicate a trend shift or wave pattern adjustment.
Conclusion
The NZDUSD is currently in a corrective phase within its Elliott Wave structure, with Orange Wave 2 in play following the completion of Orange Wave 1. This corrective movement is part of Navy Blue Wave 3, with the next major move anticipated to be Orange Wave 3.
Traders should closely monitor the completion of Orange Wave 2, as it will provide insights into the timing and direction of the next higher-degree wave.
This analysis emphasizes the importance of understanding wave structures to anticipate market movements and align trading strategies effectively.
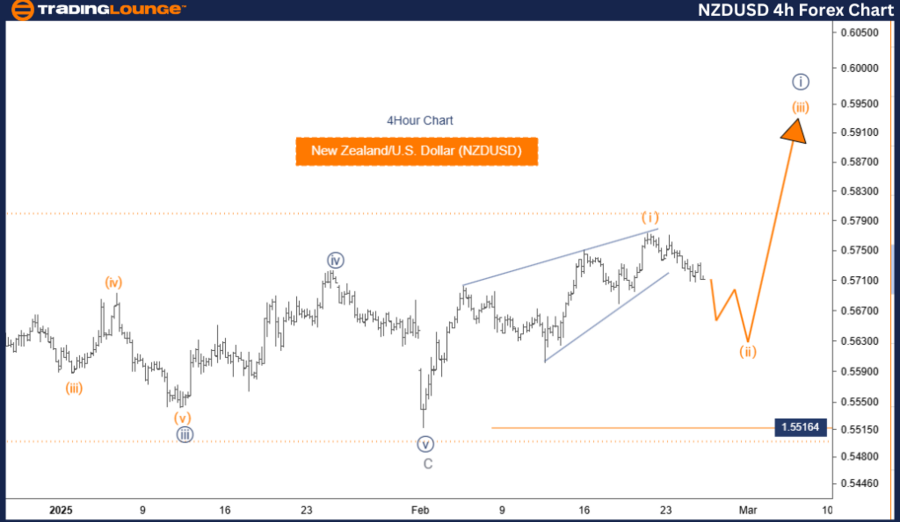
New Zealand Dollar / U.S. Dollar (NZDUSD) – 4-Hour Chart.
NZD/USD Elliott Wave technical analysis
-
Function: Counter Trend.
-
Mode: Corrective.
-
Structure: Orange Wave 2.
-
Position: Navy Blue Wave 3.
-
Direction next higher degrees: Orange Wave 3.
-
Wave cancel invalid level: 0.55164.
Analysis details
The NZDUSD Elliott Wave Analysis for the 4-hour chart highlights a counter-trend scenario, indicating a corrective market structure.
The current analysis identifies the market as being in Orange Wave 2, which forms part of a larger corrective pattern. This Orange Wave 2 is positioned within Navy Blue Wave 3, suggesting that the market is in an intermediate corrective phase before resuming its broader trend.
The next higher-degree movement anticipated is Orange Wave 3, expected to follow the completion of the ongoing corrective phase.
Key observations
-
Orange Wave 1 appears to be completed, and the market is transitioning into Orange Wave 2.
-
Wave 2 is expected to show corrective characteristics, likely involving sideways or downward movement before the next impulsive wave (Orange Wave 3) begins.
-
The completion of Orange Wave 2 is a crucial point for traders, as it signals the potential start of Orange Wave 3, which could drive the market in the direction of the larger trend.
Key level to watch
-
Wave Cancellation Invalid Level: 0.55164
-
If the price moves above this level, the current wave count will be invalid, requiring a reassessment of the market structure.
-
This level serves as a key resistance, and a break above it could indicate a trend shift or wave pattern adjustment.
Conclusion
The NZDUSD is currently in a corrective phase within its Elliott Wave structure, with Orange Wave 2 in play following the completion of Orange Wave 1. This corrective movement is part of Navy Blue Wave 3, and the next significant move is anticipated to be Orange Wave 3.
Traders should closely monitor the completion of Orange Wave 2, as it will provide insights into the timing and direction of the next higher-degree wave.
This analysis highlights the importance of understanding wave structures to anticipate potential market movements and optimize trading strategies accordingly.
Technical analyst: Malik Awais.
NZD/USD Elliott Wave technical analysis [Video]
Author

Peter Mathers
TradingLounge
Peter Mathers started actively trading in 1982. He began his career at Hoei and Shoin, a Japanese futures trading company.


