NZD/USD Elliott Wave technical analysis [Video]
![NZD/USD Elliott Wave technical analysis [Video]](https://editorial.fxsstatic.com/images/i/NZDUSD-bullish-animal.png)
NZD/USD Elliott Wave technical analysis
-
Function: Bullish Trend.
-
Mode: Impulsive.
-
Structure: Navy Blue Wave 1.
-
Position: Gray Wave 1.
-
Direction next higher degrees: Navy Blue Wave 1 (Started).
-
Details:
-
Navy Blue Wave 1 of Gray Wave 1 signals a new trend in play.
-
Wave cancellation invalid level: 0.55406.
-
NZD/USD Elliott Wave analysis overview
The NZDUSD Elliott Wave Analysis on the daily chart provides an in-depth technical outlook for the New Zealand Dollar / US Dollar currency pair.
Market trend and structure
-
The analysis identifies the current market phase as part of a bullish trend, suggesting a strong upward movement.
-
The impulsive mode indicates a sustained directional move, rather than a corrective or sideways pattern.
-
The market movement is labeled as Navy Blue Wave 1, which is a sub-wave within Gray Wave 1, part of a larger Elliott Wave cycle.
Key observations
-
Navy Blue Wave 1 of Gray Wave 1 is actively developing, marking the start of a new bullish trend.
-
The next higher degree trend is expected to continue with Navy Blue Wave 1, supporting a broader bullish movement.
-
The wave cancellation invalid level is set at 0.55406, meaning that if the price falls below this level, the current wave count will be invalidated, requiring a revised analysis.
Conclusion
The NZDUSD is currently in an impulsive bullish phase, labeled as Navy Blue Wave 1, which forms part of a larger trend within Gray Wave 1. This signals the beginning of a new upward movement, making it a key phase for traders to monitor.
The invalidation level at 0.55406 serves as a critical confirmation point for validating the wave structure. This analysis offers a structured framework to understand the market’s current position and anticipate future price movements within the bullish trend.
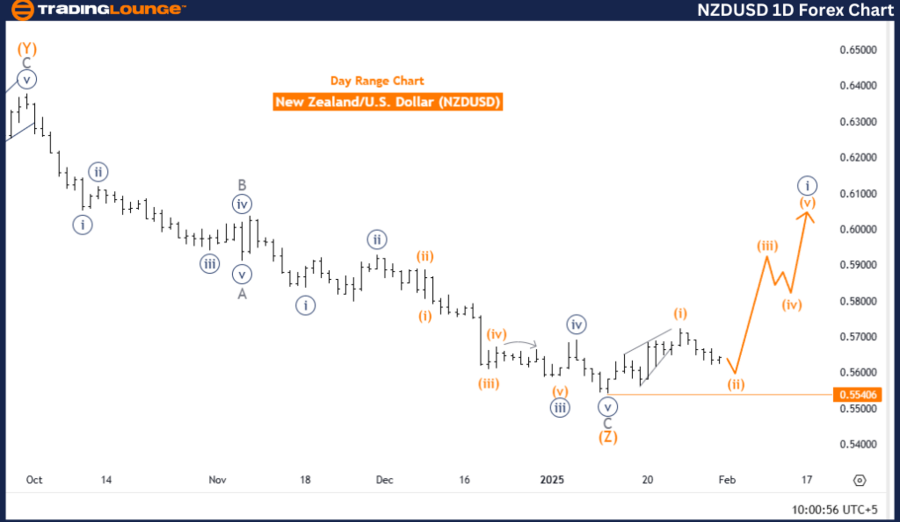
NZD/USD – Day chart
NZD/USD Elliott Wave technical analysis
-
Function: Counter-Trend.
-
Mode: Corrective.
-
Structure: Orange Wave 2.
-
Position: Navy Blue Wave 1.
-
Direction next higher degrees: Orange Wave 3.
-
Details:
-
Orange Wave 1 of Navy Blue Wave 1 appears complete.
-
Orange Wave 2 is currently developing.
-
Wave cancellation invalid level: 0.55406.
-
NZD/USD Elliott Wave analysis overview
The NZDUSD Elliott Wave Analysis on the 4-hour chart provides a detailed technical perspective on the New Zealand Dollar / US Dollar currency pair.
Market trend and structure
-
The analysis identifies the current phase as a counter-trend movement, indicating a temporary reversal within the broader trend.
-
The corrective mode suggests the market is undergoing a retracement or consolidation, rather than continuing in the primary trend direction.
-
The market structure is labeled as Orange Wave 2, a sub-wave within Navy Blue Wave 1, part of a larger Elliott Wave cycle.
Key observations
-
Orange Wave 1 of Navy Blue Wave 1 appears to be complete, with Orange Wave 2 now in progress.
-
This corrective wave should be closely monitored as it could indicate potential trade opportunities.
-
The next anticipated move is Orange Wave 3, which typically signals a strong directional movement after the correction ends.
-
The wave cancellation invalid level is set at 0.55406, meaning if the price moves beyond this level, the current wave count becomes invalid, requiring a revised analysis.
Conclusion
The NZDUSD is currently in a corrective phase, labeled as Orange Wave 2, within a larger counter-trend movement inside Navy Blue Wave 1. Once Orange Wave 2 completes, the market is expected to transition into Orange Wave 3, which could indicate a potential resumption of the broader trend.
Traders should watch for the completion of the corrective phase and monitor the invalidation level at 0.55406 to confirm the wave structure's validity. This analysis provides a clear framework for understanding the market’s current position and anticipating future price movements.
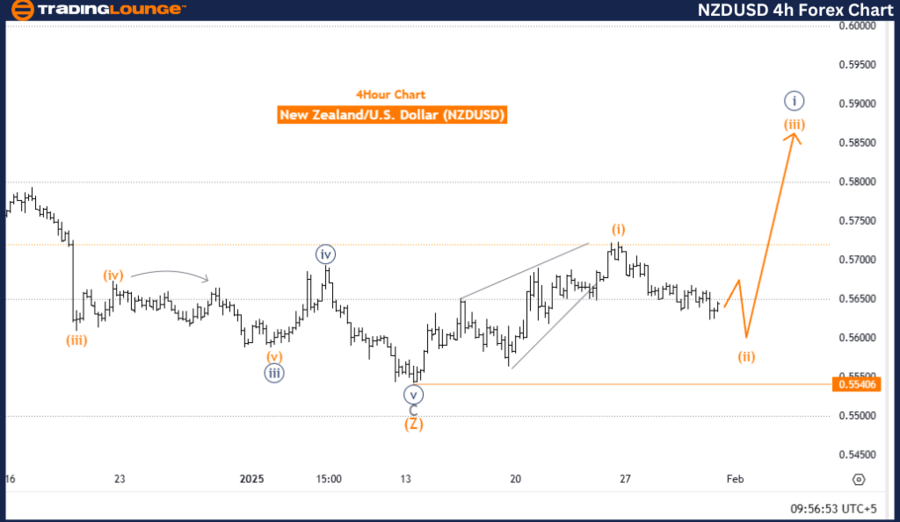
NZD/USD – Four-hour chart
NZD/USD Elliott Wave technical analysis [Video]
Author

Peter Mathers
TradingLounge
Peter Mathers started actively trading in 1982. He began his career at Hoei and Shoin, a Japanese futures trading company.


