November 2025 forex outlook

Policy, tariff, and market range
The forex market heads in November 2025 in different light than a quarter ago. To date, the U.S. federal reserve cut rates 25bp for the first time this year, moving rates into 4.00%-4.25% range. With that being said, markets are expected another rate cut at the end of October 2025, and another one priced in for December 2025. These cuts are seen in CME’s FedWatch tool and in the Fed’s own September minutes. In parallel, the European Central Bank has been on hold at 2.00 percent since September and judged the current stance “robust enough to manage shocks.” The Bank of England has also shifted into an “on hold, but not done” cadence at 4.00 percent. To the contrary, the Bank of Japan is still running the world’s lowest G-7 policy rate at 0.50 percent as it tries to entrench a fragile exit from deflation psychology. With all being said, the OECD’s outlook as of September 2025 describes a world economy that has proved resilient but is set to slow from 3.3 percent growth in 2025 to 3.2 percent in 2025 and 2.9 percent in 2026. The OECD even estimates the effective U.S. tariff rate had climbed to 19.5 percent by end of August, which is the highest in decades. The FX market is now re-pricing carry, growth, and safety simultaneously as November event risk approaches.
EUR/USD forecast
EUR/USD daily chart
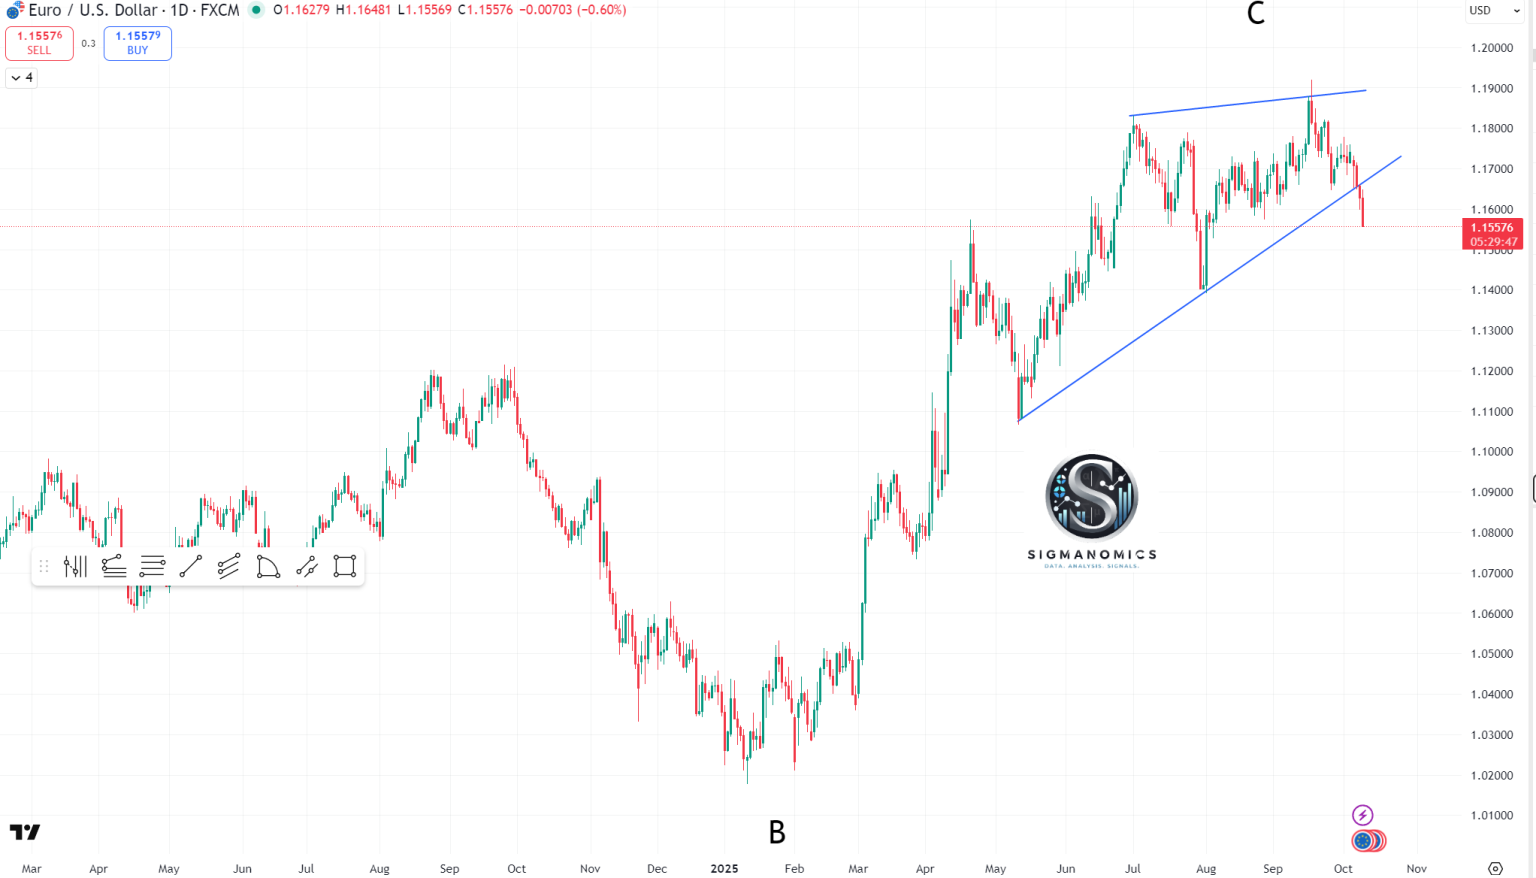
EUR/USD has slipped below the rising trendline that has been in place in late June 2025, with the upper boundary around 1.190 zone appearing to be rolling over. As such, bears appear to be gaining momentum with key technical targets in the 1.08 area. Apart from above’s daily chart, multiple timeframes also support this bias. Take for example, the 20-day, 50-day, 100-day moving averages are above all above current price, displaying bearish signals. Looking ahead, if support at 1.1550-1.1600 fails, the next structural support would lie nearer 1.1400 or lower. To the contrary, EUR/USD would need to recapture 1.1770-1.1800 and sustain above that to put bullish focus back view.
From a institutional standpoint, J.P. Morgan sees EUR/USD reaching 1.22 by March 2026 on the view that U.S. moderation, currency rebalancing flows, and German fiscal support will help the euro.
GBP/USD forecast
GBP/USD weekly chart
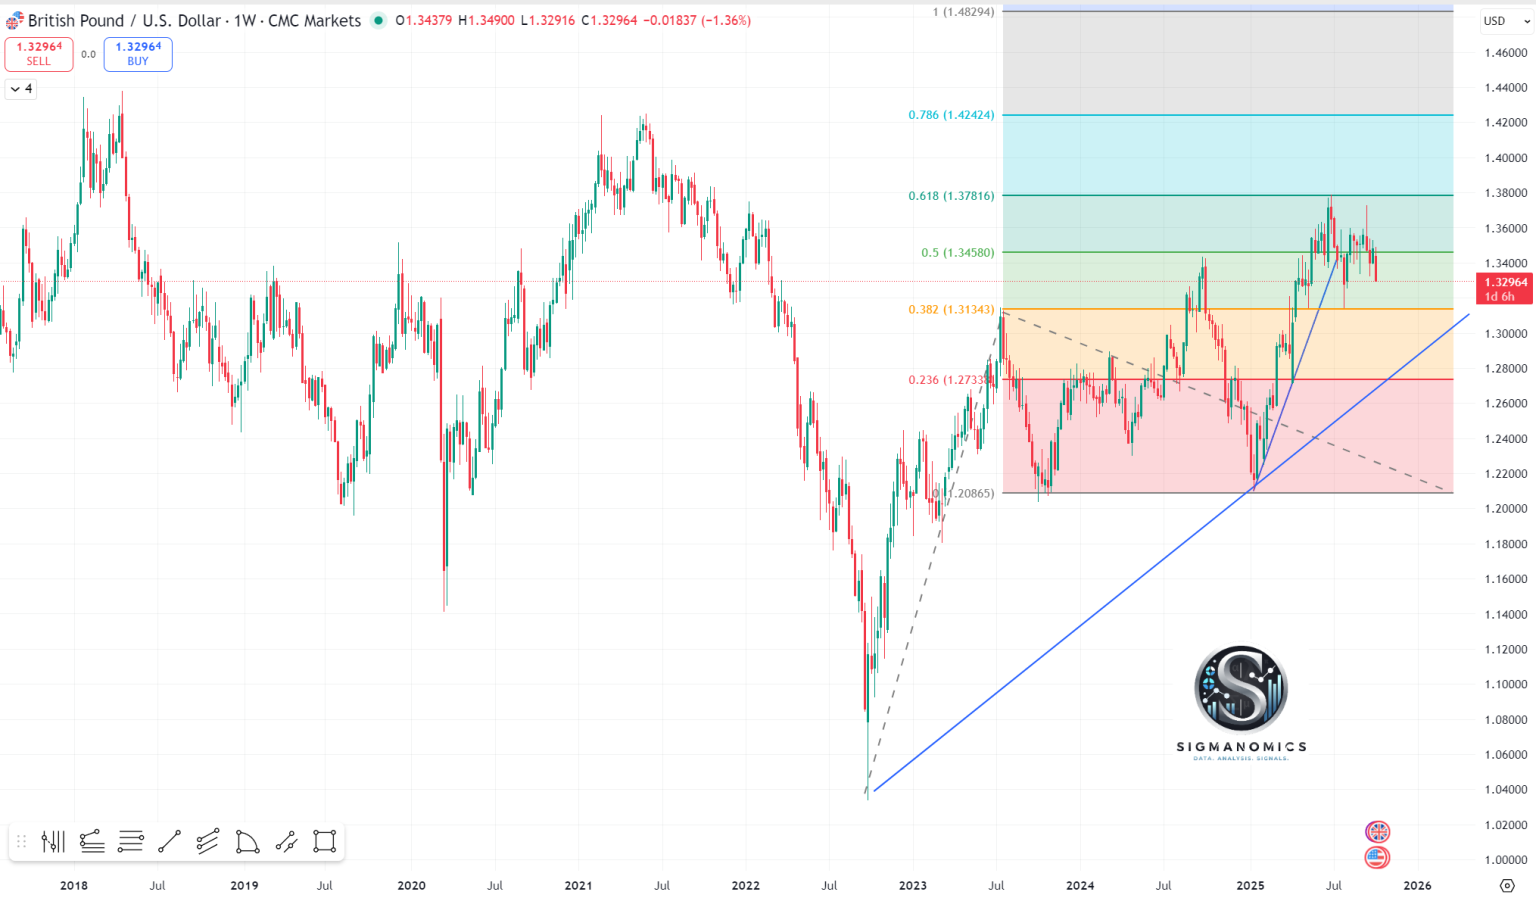
The Forex outlook for GBP/USD favors downside risks similar to its counterpart EUR/USD. To date, the pair has rejected the weekly 0.618 fibonacci extension at 1.38 and looks to heads south with targets at the rising trend line support at the 1.30 level.
The knife-edge technical setup also meets a fundamental backdrop where U.K. deflation path is sticky while the Fed is easing. Recently, U.K. CPI prined at 3.8 percent year-over-year, while CPIH printed 4.1 percent y/y. With these developments alongside other sticky measures, the Bank of England has signaled that inflation could hover above target into 2026, which argues caution on the pace of cuts in the region. Across the pond, the Fed has finally started to ease in the fourth quarter of 2026, with strategist polls anticipating a weaker dollar over 6-12 months as the worlds largest economy easing cycle progresses.
USD/JPY forecast
USD/JPY weekly chart
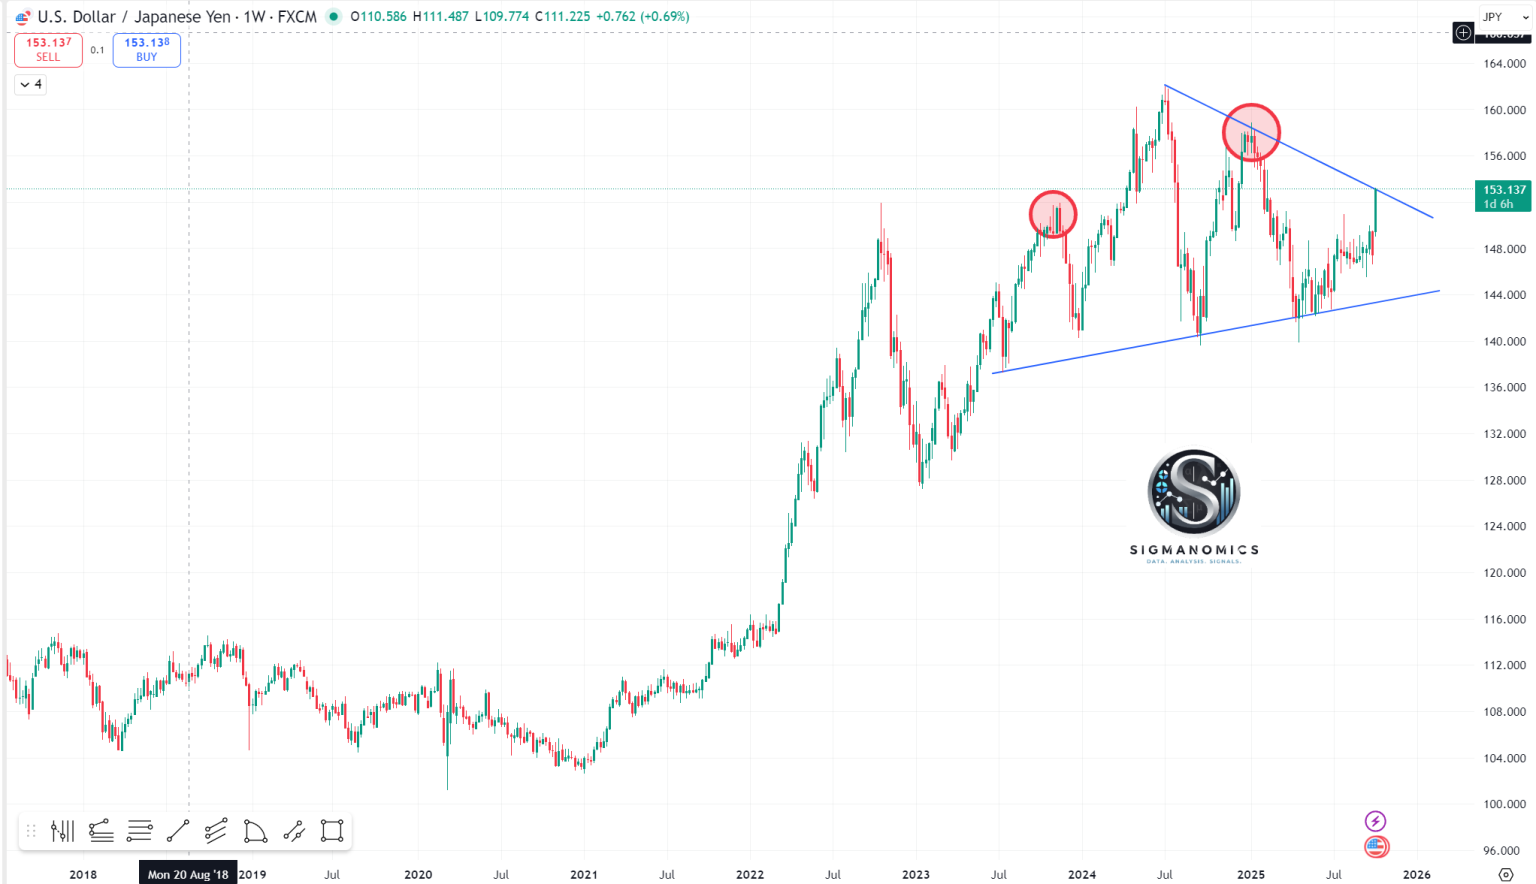
The USD/JPY is trading within the weekly triangle. At the same time, a posible weekly head and shoulders has formed with neckline at 144.0. Should there be a breakout and close below support, bears will look to target projection in the 120 area.
Author

Sigmanomics
Sigmanomics
Sigmanomics is a financial intelligence platform that delivers expert insights, data-driven analysis, and real-time trading signals across global markets.














