Non-Farm Payrolls Preview: Don't speak of gloom, show me
- ADP April private payrolls jump 275,000, highest since July, March revised to 151,000 from 129,000
- Initial jobless claims at 230,000, 4-week average to 212,500
- March NFP recovered to 196,000 from 33,000 in February

The Bureau of Labor Statistics (BLS) of the US Labor Department will release its Employment Situation Report for April on Friday May 3rd at 8:30 am EDT, 12:30 GMT.
Non-Farm Payrolls and the Employment Situation Report
Most commonly called non-farm payrolls, NFP or simply payrolls for its best-know statistic, the Employment Situation Report is the most closely watched and traded American economic statistic.
The report is a monthly assessment of the US labor market. It compiles information on job creation, unemployment, average hourly earnings, labor force participation, average work week and other factors. Bureau economists estimate the number of new employees at start-up companies and include them in the overall payroll figure. These estimated numbers are revised at a later date against data from companies. The BLS report is the timeliest of the government’s many statistical efforts as its information is just one month old.
The report comprises two different surveys, the establishment survey and the household survey. The establishment survey asks non-farm businesses about their number of employees, compensation, hours and other factors of employment. This poll produces the payroll, earnings, labor force participation, average workweek and other numbers.
The household survey interviews a representative sample of the US working-age civilian population and classifies each person as employed, unemployed or not in the labor force. The best know unemployment rate, officially U-3, was 3.8% in March. This rate requires that for an individual to be classified as unemployed they must have looked for work in the prior month. The U-6 rate, 7.3% in March, considers someone unemployed if they searched for work anytime in the prior year. Anyone not employed or looking for work under the U-3 definition is not counted as part of the workforce.
Forecast
Non-farm payrolls are expected to rise by 185,000 in April after its 196,000 gain in March. Manufacturing employment will add 10,000 workers following a 6,000 loss in March and a 1,000 increase in February. The U-3 unemployment rate is predicted to be unchanged at 3.8%, as is the U-6 rate at 7.3%. Average hourly earnings are projected to rise 0.3% on the month, up from the March 0.1% gain and to climb 3.3% on the year, from the 3.2% increase in March. The average workweek will be the same at 34.5 hours and the labor force participation rate to remain at 63.0%.
Coincident Labor Market Statistics
In addition to the trend in the payrolls themselves several other statistics give an indication of the general health and direction of the labor market: ADP private payrolls; initial jobless claims and the employment purchasing managers’ index from the Institute for Supply Management.
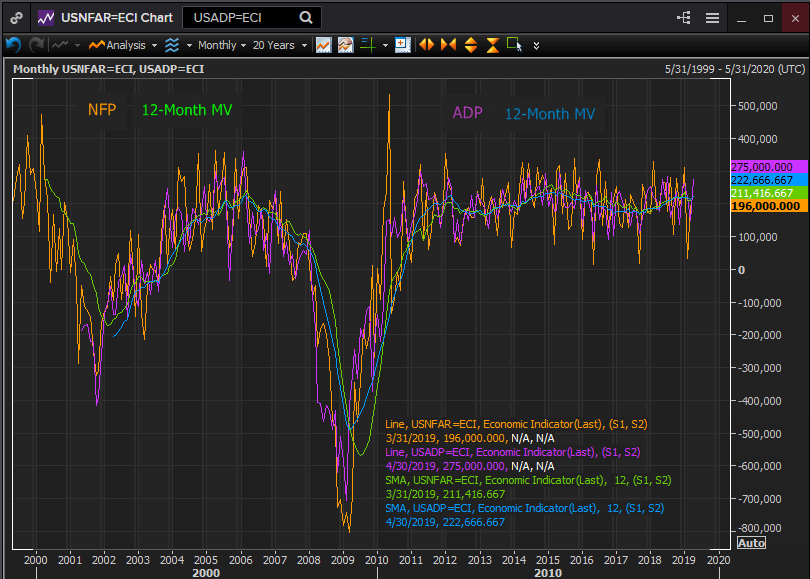
NFP and ADP
The relationship between the trends in ADP and NFP, as might be expected, is very close.
Reuters
The monthly hiring decisions of the 411,000 firms that use ADP’s payroll services are well correlated with the private payrolls function of the NFP report. They are somewhat less correlated with the overall payroll numbers from the government which include hiring at local, state and federal offices.

Reuters

Reuters
Month to month directional correlation is strong between the ADP and NFP numbers, meaning that both results generally rise and fall together. Months such as March when NFP rose from 33,000 in February to 196,000 but ADP fell from 220,000 to 151,000 are relatively uncommon.
Normally ADP is a subset of the larger NFP employment but in months when government work is in decline they can reverse positions. The ADP numbers have one accuracy advantage over those of the BLS, they are reported figures, actual hires whose payments are computed by the payroll company. The NFP numbers include an estimate for new, but unreported jobs.
The 275,000 new employees added to the ADP rolls in April were the most in nine months. The 12-month moving average has moved steadily higher since September 2017 and the April average of 222,667 was the second highest since July 2015.
Private sector hiring in the ADP report shows no sign of a change in trend, volume or volatility. It has returned to the high point of the last two years and is comparable with the best post-recession scores.
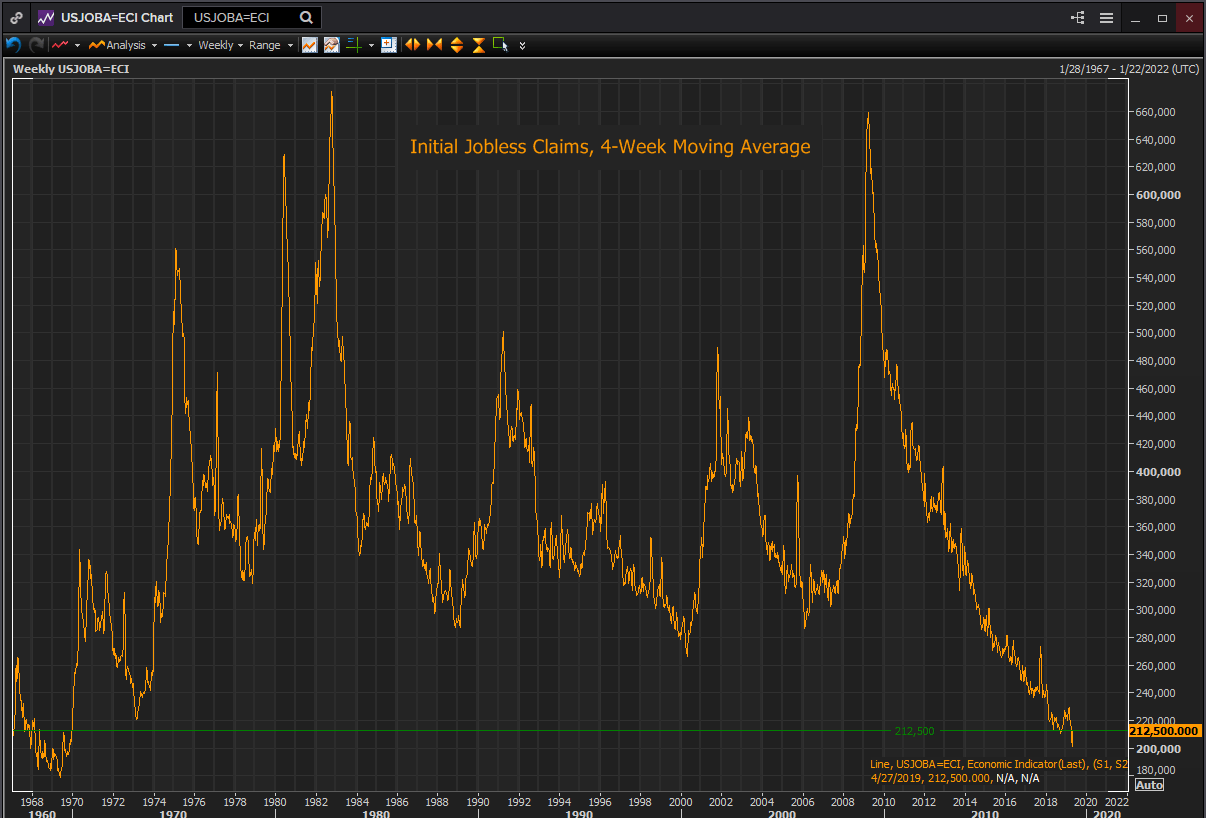
Initial Jobless Claims
Initial jobless claims are the best and earliest indicator of dislocation in the labor market. Claims began to rise in September 2007 a year before the financial crisis hit and they skyrocketed in June 2008 months ahead of the crux in the fourth quarter of 2008.
The 4-week moving average for initial claims was 212,500 in the week of April 27th. The last time the average was this low was almost 50 years ago, in December 1969.
It is impossible to discover a negative aspect for payrolls and job creation in the labor market performance that has produced these levels of jobless claims.
Reuters
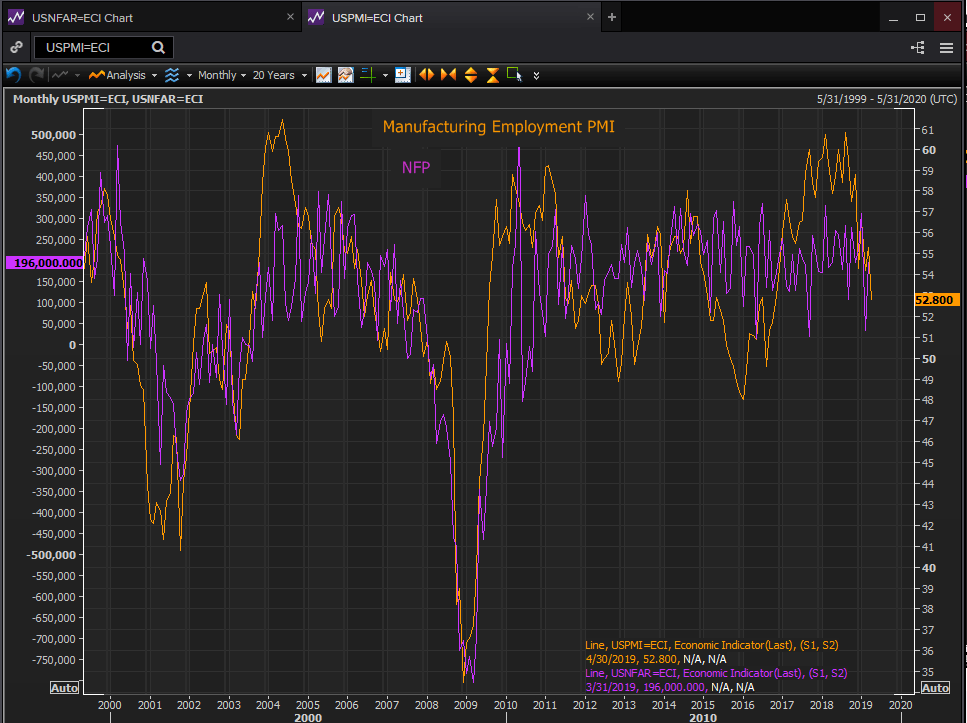
Employment PMI
The PMI index is essentially a sentiment function. While the survey asks purchasing managers about the tenor of their business, order flows, hiring plans and other aspects of continuing operations it does not, for example, query how many workers were hired or fired, or the actual the volume of new orders. It asks for the managers’ impressions without requiring quantification.
The April manufacturing employment PMI dropped sharply to 52.4 from 57.5 in March. In February it was 52.3, in January 55.5 and in November 57.7. For the PMI readings there has been recurring volatility in the indexes that is not tied to any change in the underlying economic circumstances.
Over the past four years payrolls have roughly averaged between 150,000 and 250,000 per month. There has been volatility in the month to month results but not in the overall range.
In contrast and over the same period, the PMI employment index has seen two prolonged shifts. In 2015 the index declined for almost the whole year, touching a post-crash low of 48. Then, in late 2016, after the US election it soared reaching a post-crisis high in 2018. During the three year round trip in the PMI employment index the range of payrolls did not change. The actual hiring decisions of businesses did not reflect the cycles of pessimism and optimism of the respondent to the PMI survey.
Reuters
Conclusion
Initial jobless claims and ADP payrolls indicate the US labor market remains strong and productive. The decline in employer sentiment may be an aversion to the partial federal government shutdown in January, it may be a correction brought on by the two year optimism festival that followed the 2016 election or it may be the excessive wariness of executives who assume that bad times must follow good.
Pessimism can be cured by facts. If the worried executives portrayed in the PMI results see continuing job creation and rising wages in the next months, their attitude will change as quickly as it did in the fall of 2016.
Author

Joseph Trevisani
FXStreet
Joseph Trevisani began his thirty-year career in the financial markets at Credit Suisse in New York and Singapore where he worked for 12 years as an interbank currency trader and trading desk manager.


