No doom and gloom for the US stock market, yet

Last week's bearish correction in the stock market, which was brought about by a temporary downturn in the tech sector, prompted many traders to speculate whether this was the beginning of the end for the recent bullish rally. Yet, stocks have rebounded since then, demonstrating strong buying pressure in the market, as investors' interest does not seem to wane.
The December futures contract of the Russell 2000 index advanced earlier today after the market open, on investors' expectations regarding the outcome of the highly anticipated FOMC September meeting. Most market participants expect the FOMC to preserve its accommodative monetary policy stance. The latter has influenced the current bullish run that was initiated in the wake of the coronavirus crash.
Thus, today's analysis examines the current trading setup of the mini December contracts of the Russell 2000 index and outlines the potential for future gains following the conclusion of the FED meeting.
1. Long-Term Outlook:
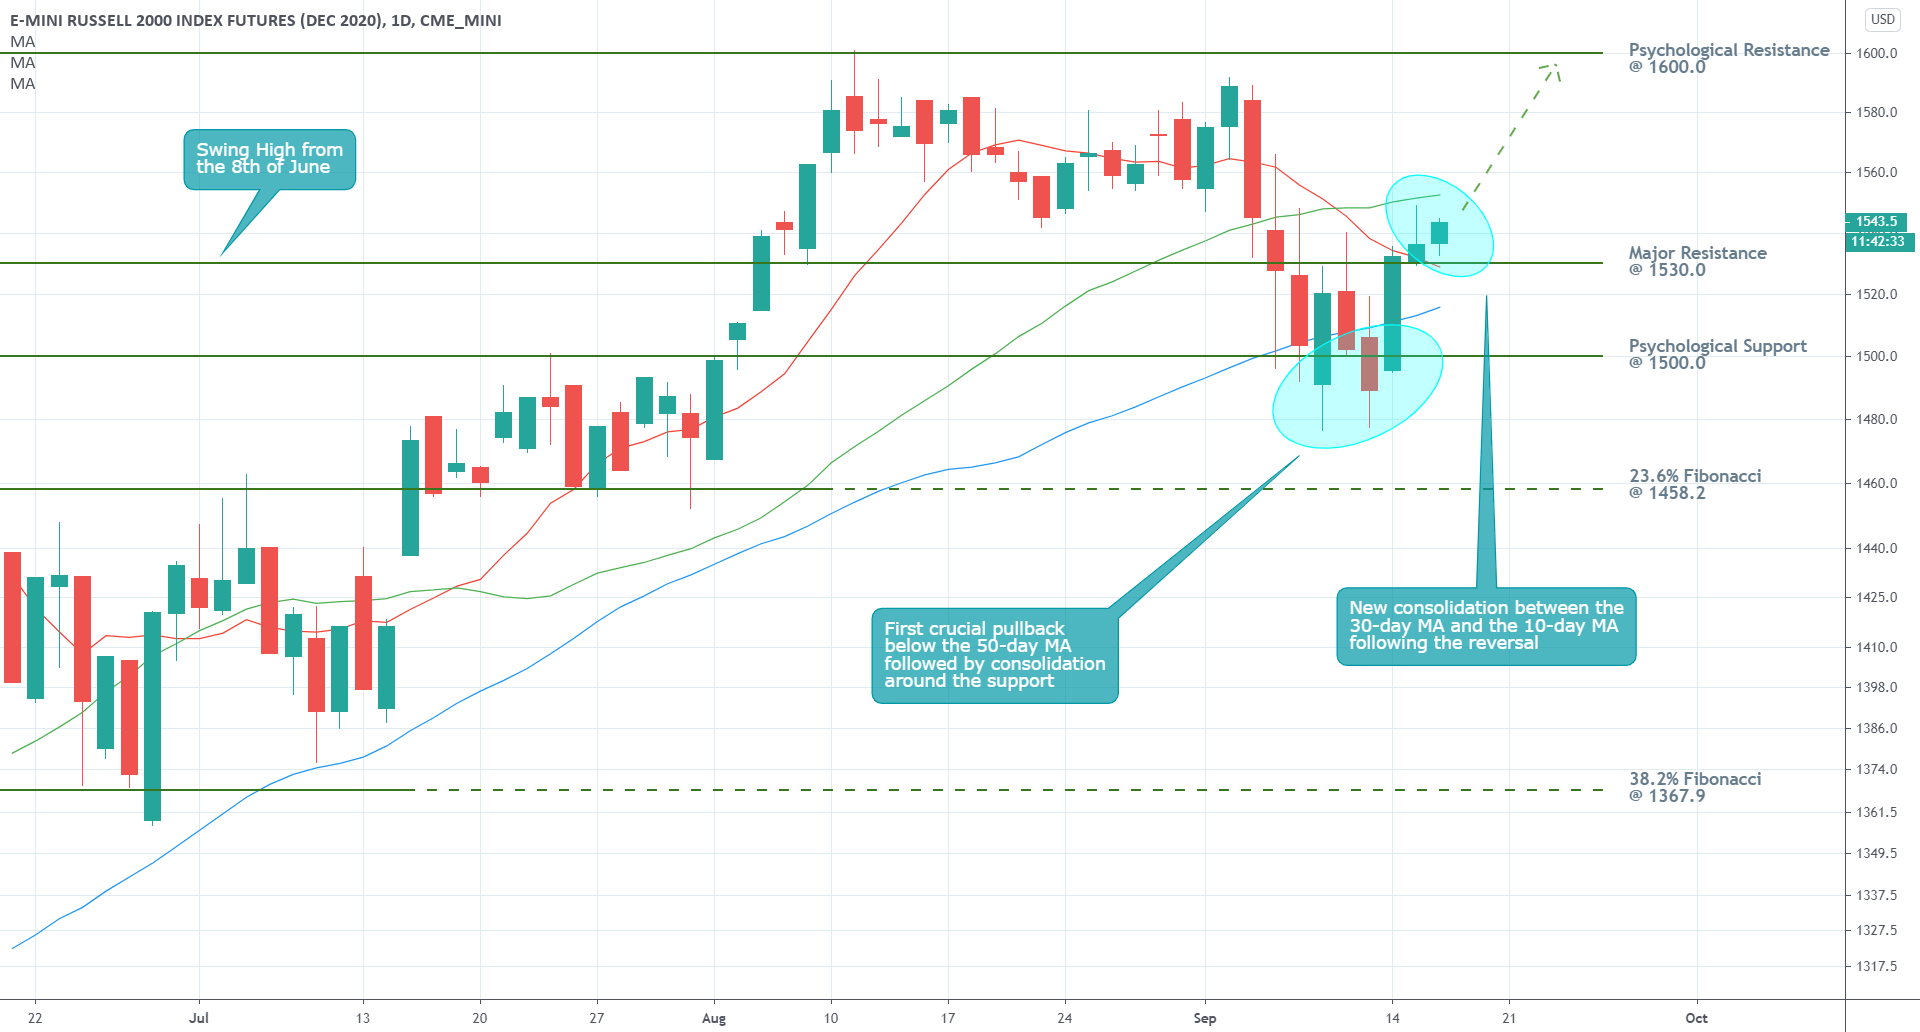
As can be seen on the daily chart below, several crucially important developments have transpired over the past couple of days. Firstly, the price action has successfully broken back above the major resistance level at 1530. The latter was established as a prominent price level on the 8th of June when the price action rebounded and established a new swing high. Therefore, with yesterday's key breakout, the recent bearish correction can be regarded as concluded.
The second piece of evidence demonstrating the end of this bearish correction can be derived from examining the temporary consolidation of the price action below the psychologically significant price level at 1500.0. As can be seen, the temporary fluctuations below this key support also extended below the 50-day MA (in blue), which also represents a significant floating support.
A decisive breakdown below the two would have likely demonstrated the beginning of a new massive dropdown. However, the prompt reversal of the price action above the two supports manifested the significant bullish commitment in the market. In other words, the market is not yet ready to commence developing a new bearish trend. It follows that the price action is now most probably going to resume trading higher.
Thirdly, the price action is currently consolidating in a tight range between the 10-day MA (in red), which presently converges towards the major support at 1530.0, and the 30-day MA (in green). A breakout above the latter would signify the complete invalidation of the previous bearish correction, and would therefore open up the possibility for the price action to resume climbing. The next most likely target level for the reinstated bullish uptrend would be the next psychological barrier – the resistance at 1600.00
2. Short-Term Outlook:
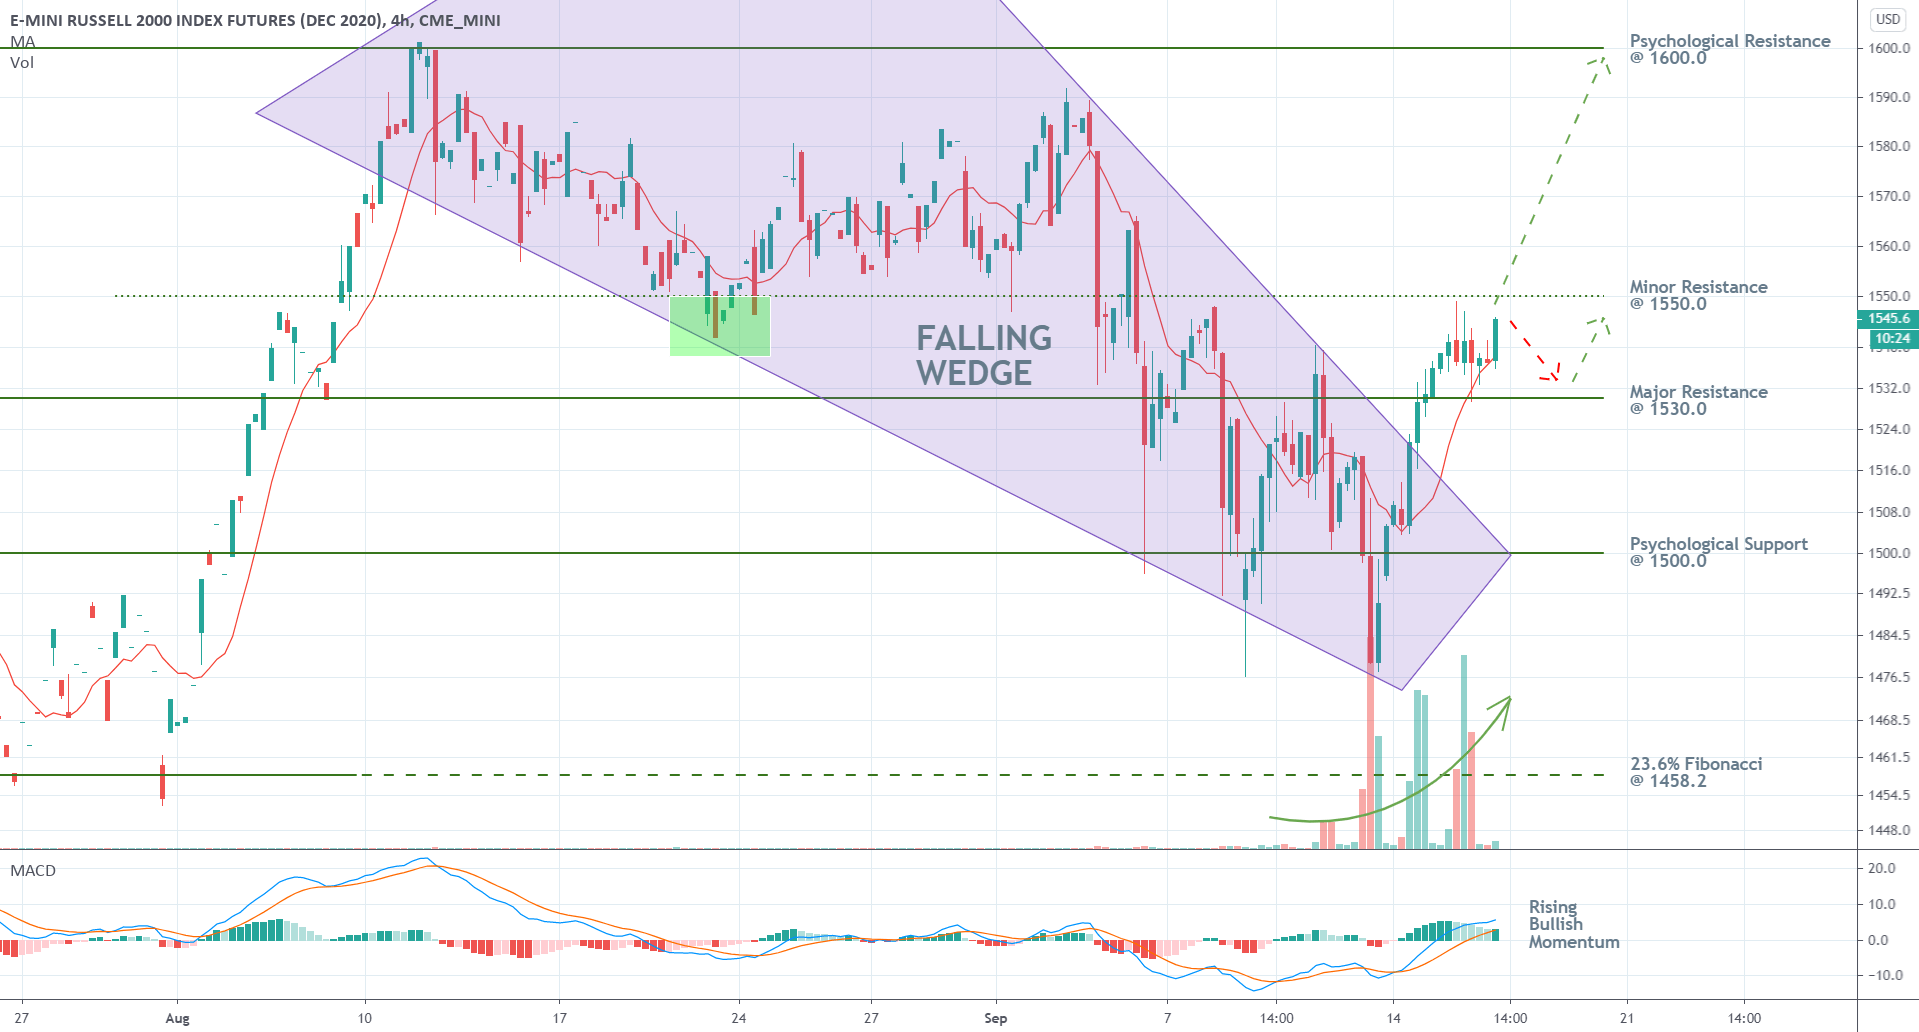
Examining the 4h chart below reveals the establishment of a classic trend continuation pattern. Ever since the preceding bullish uptrend reached the psychological resistance at 1600.0, the price action has been depreciating. The resulting structure represents a prominent Falling Wedge pattern, which typically entails rising bullish sentiment. In light of the aforementioned breakout above the major resistance level at 1530.0, the development of the Falling Wedge pattern can now be regarded as completed. This is perfectly inlined with the primary expectations for the continuation of the price action's advancement further north.
As can also be seen, the underlying bullish volume has increased considerably over the last several days, which is consistent with the main expectations. The MACD indicator is also signalling steadily rising bullish momentum, which would likely support the future development of the currently emerging upswing. The final bullish signal that is worth noting is the fact that the price action remains concentrated above the 10-day MA. For as long as this relationship is maintained, the underlying market bias would remain mostly bullishly oriented in the short-term.
If the price action manages to break out above the minor resistance level at 1550.0, whose significance has already been confirmed at least once in the past, then there will be no more barriers for the newly emerging uptrend to head towards the psychological resistance at 1600.00. Conversely, if the price action fails to break out above the interim resistance, it could continue to consolidate in a tight range between 1550.0 and 1530.0
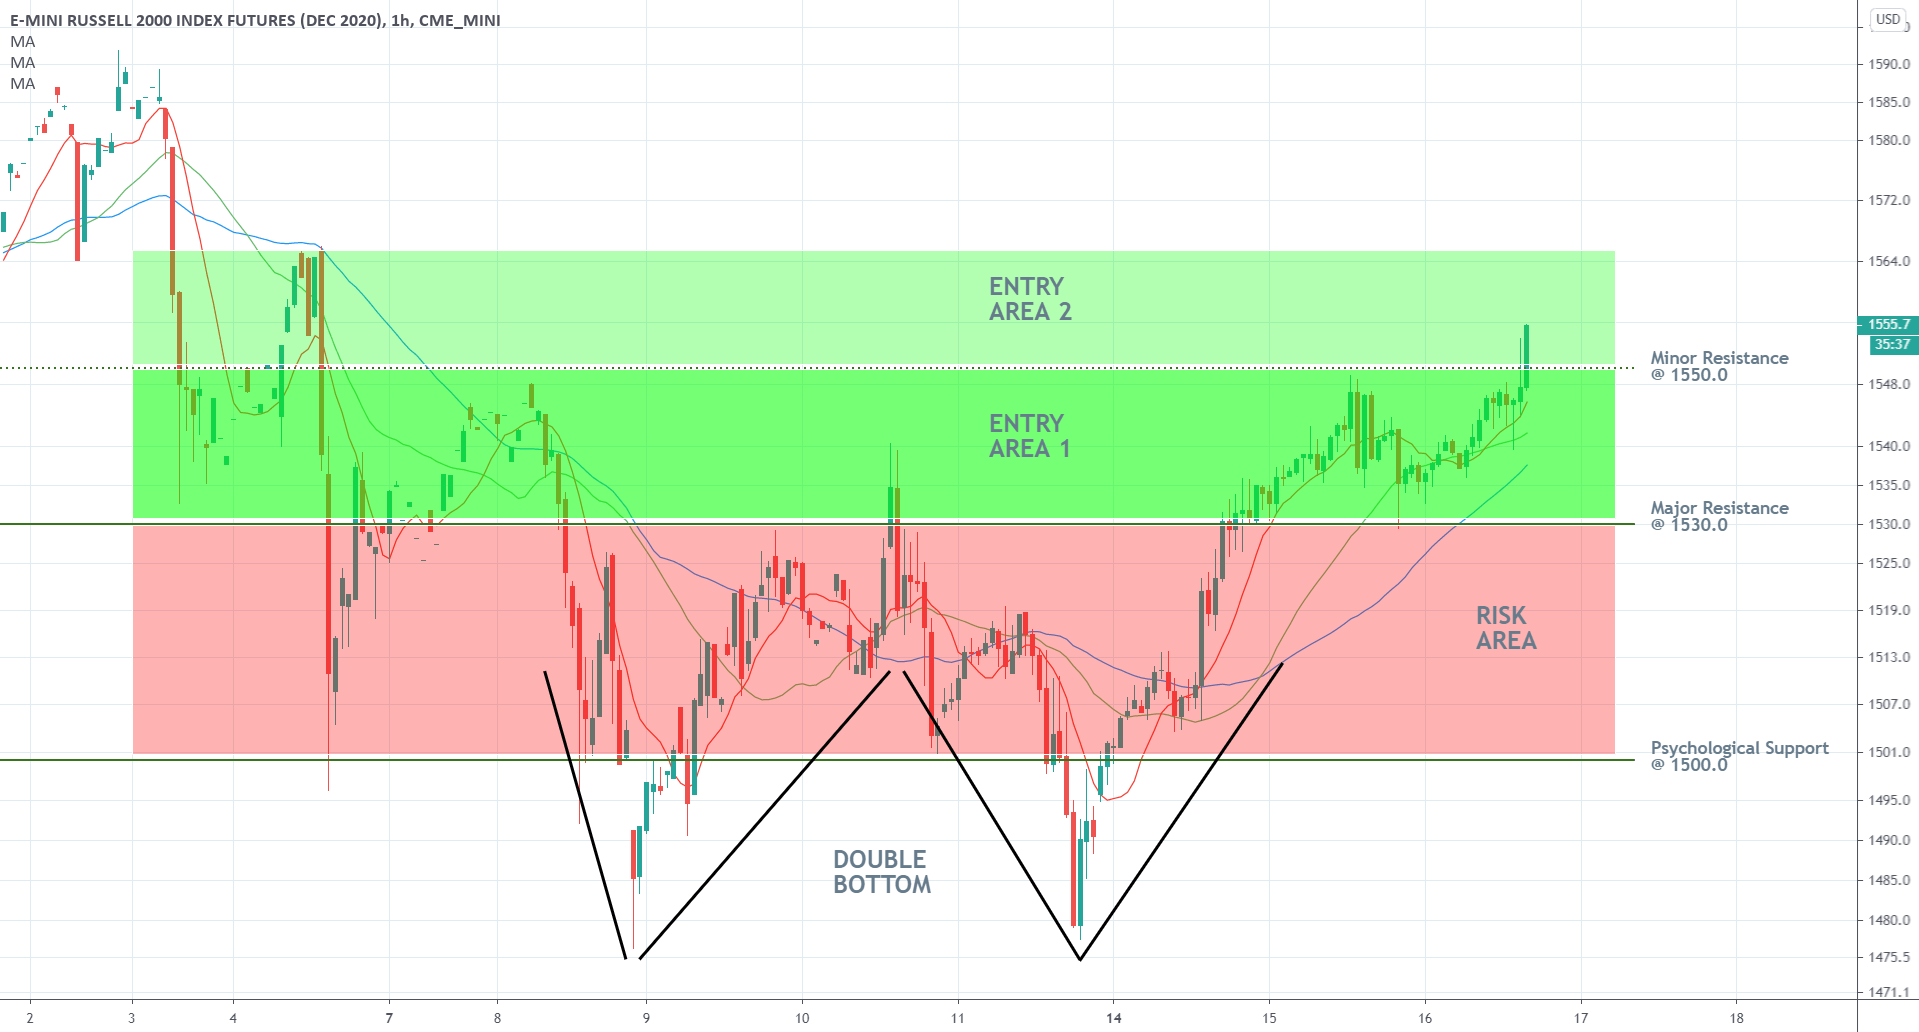
Finally, the hourly chart below delivers the most significant piece of evidence demonstrating the termination of the recent bearish correction. The emergence of a Double Bottom pattern, which typically entails the termination of a preceding downtrend, at the lower end of the Falling Wedge signals the beginning of a new uptrend. Moreover, the fact that the price is trading above the three moving averages demonstrates considerable bullish bias in the short-term. The 10-day MA is positioned above the 30-day MA, which, in turn, is placed above the 50-day MA. This ascending order confirms the primary expectations.
The current market setup is perfect for swing traders who can now enter long as the market attempts another breakout above the psychological resistance at 1600.0. Position traders too can place buying orders, as they weigh in on the continuation of the underlying bullish rally in the longer run.
The two entry areas in green represent suitable places for the execution of long orders, with area 2 being more suitable for risk-averse traders. Meanwhile, the risk area in red elucidates the threat of a sudden change in the underlying market sentiment. If the price action falls to the red area, this would most probably signify an unexpected termination of the currently prevailing bullish bias.
3. Concluding Remarks:
The behaviour of the underlying price action in the near future would greatly depend on the outcome of FED's meeting, which is scheduled to take place later today. Once the initial outbreak of adverse volatility settles down, the market would likely price in the decision of the FOMC, and subsequently, continue to rise north on renewed investors' optimism.
Author

Plamen Stoyanov
Trendsharks
Plamen started his career on the global capital markets in 2012 when he began trading with financial derivatives.


