Next Points for Oil Bears

Thanks to yesterday’s session crude oil lost 3% and approached the previously-broken barrier of $70. In this area oil bears met several other short-term supports, but are they stable enough to stop the sellers in the coming days?
Let’s take a look at the charts below (charts courtesy of http://stockcharts.com).
Long-term Perspective – Invalidations!
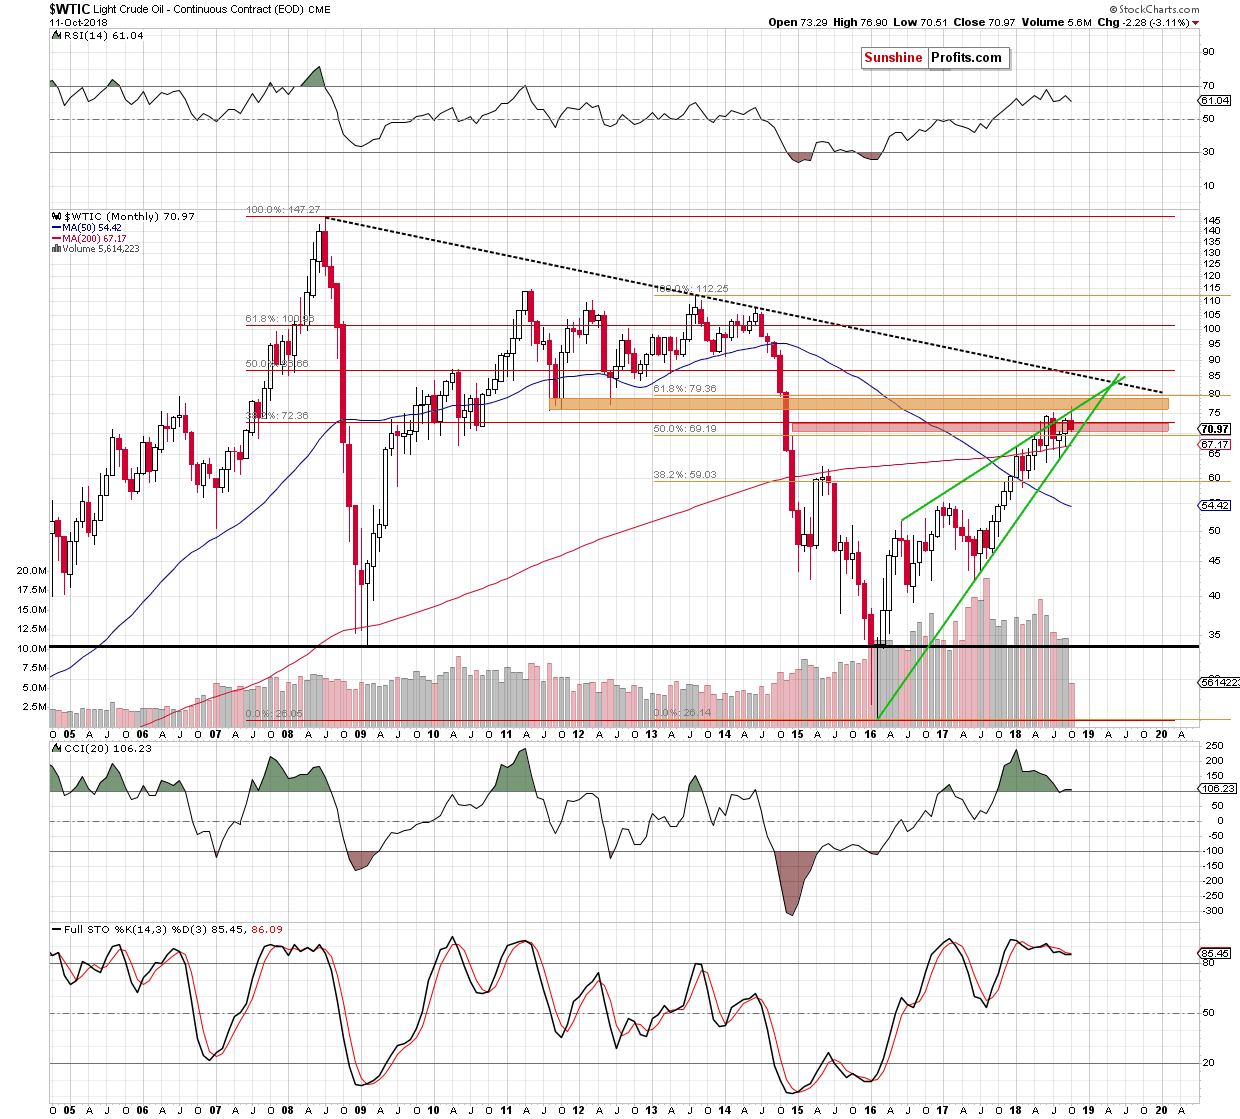
In our last Oil Trading Alert, we wrote that (…) the commodity approached the upper border of the red zone, which suggests that we can see an invalidation of the earlier breakout above the it in the coming days (…).
As you see on the monthly chart the situation developed in tune with our assumptions and crude oil closed yesterday’s session not only below the upper line of the above-mentioned zone, but also under the previously broken 38.2% Fibonacci retracement based on the entire 2008-2016 downward move.
In this way, the commodity invalidated the earlier breakouts, which doesn’t bode well for oil bulls – especially when we factor in the current position of the long-term indicators (the Stochastic Oscillator generated the sell signal after several months of bearish divergences and the CCI is very close to doing the same – in this case we could also observe a deepening bearish divergence).
Medium-term Chart and the Pattern
Are there any other negative technical developments? Let’s zoom in a bit our picture and examine the weekly chart. What can we infer from it?
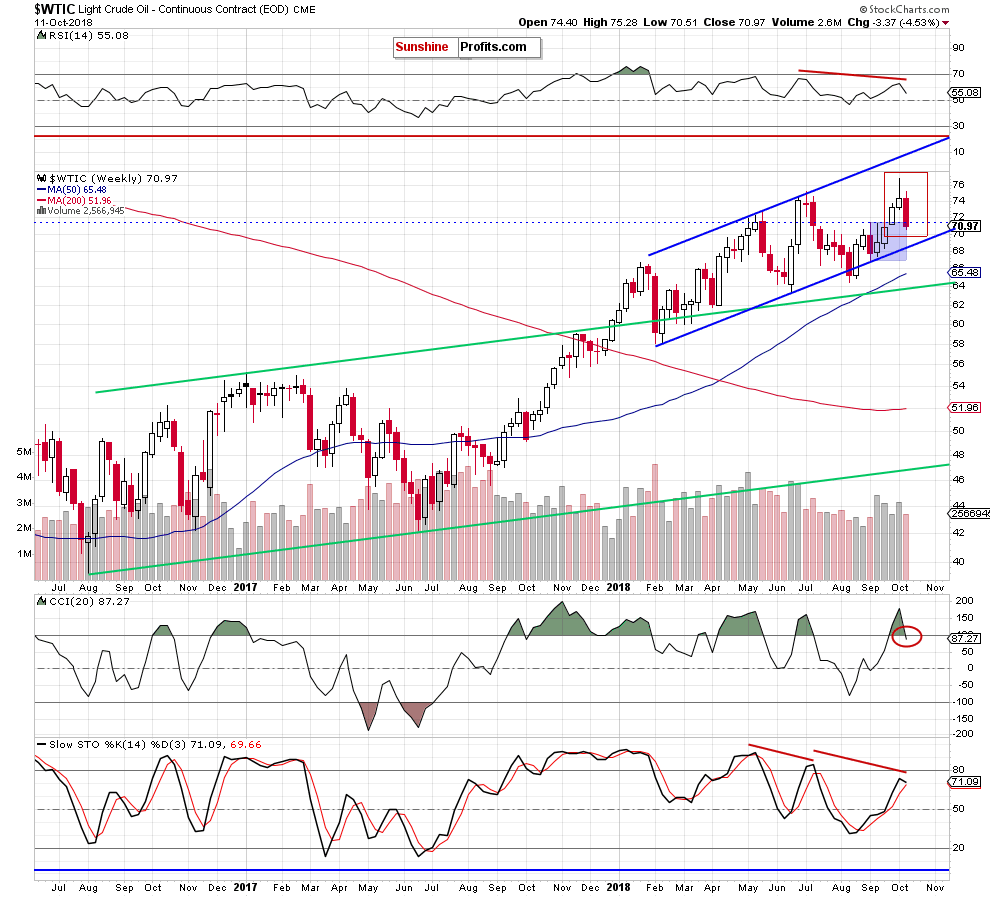
The first thing that caught our eyes on the medium-term chart was an invalidation of the earlier breakout above the upper line of the blue consolidation. Thanks to yesterday’s decline (which made our short positions even more profitable) the bears' chances for creating a pro-decline candlestick formation (the evening star) significantly increased.
What exactly does the formation look like and what does it mean?
Let's start with the fact that the stars are one of the strongest signals generated by Japanese candles. The evening star is composed of three candles and we marked the potential formation with a red rectangle.
The first of them represents a strong move consistent with the prevailing trend. The second candle has a small body, but sometimes it may also look like the doji, which makes the formation even stronger. At this point it is worth mentioning that the length of the shadows in the case of the evening star is not so important, however, when the middle candle has an elongated upper shadow (just as in our case) the signal is clearer. Then the market gives confirmation, forming of a long candle in the opposite direction to the current trend (just like during this week).
In stars, the price gap between the first and the second candle is important. In our case, it has only a few cents (free space between the closing price of the previous candle and the opening price of the next candle), however, taking into account the size of the red candle created earlier this week the implications are negative.
Nevertheless, they will be even more bearish if black gold closes the week at (or even better below) the first white candle low of $71.14. In other words, it will be enough if the bears maintain yesterday's closing price.
Will it happen? Looking at the current position of the weekly indicators, we thin that the pro-declining scenario remains in the cards. Why? First, the CCI generated a sell signal. Second, there are clearly visible negative divergences between the RSI, the Stochastic Oscillator and the price of the commodity. As you see on the above chart, a similar situation in the Stochastic Oscillator took place when the May and July peaks were formed. Back then, bearish divergences preceded a bigger move to the downside, which resulted in a test of the lower border of the blue rising trend channel. Therefore, if the history repeats itself once again, we can see further deterioration in the coming week(s).
Crude Oil from the Short-term Perspective
Is there anything in the short term that can thwart oil bears’ plans?
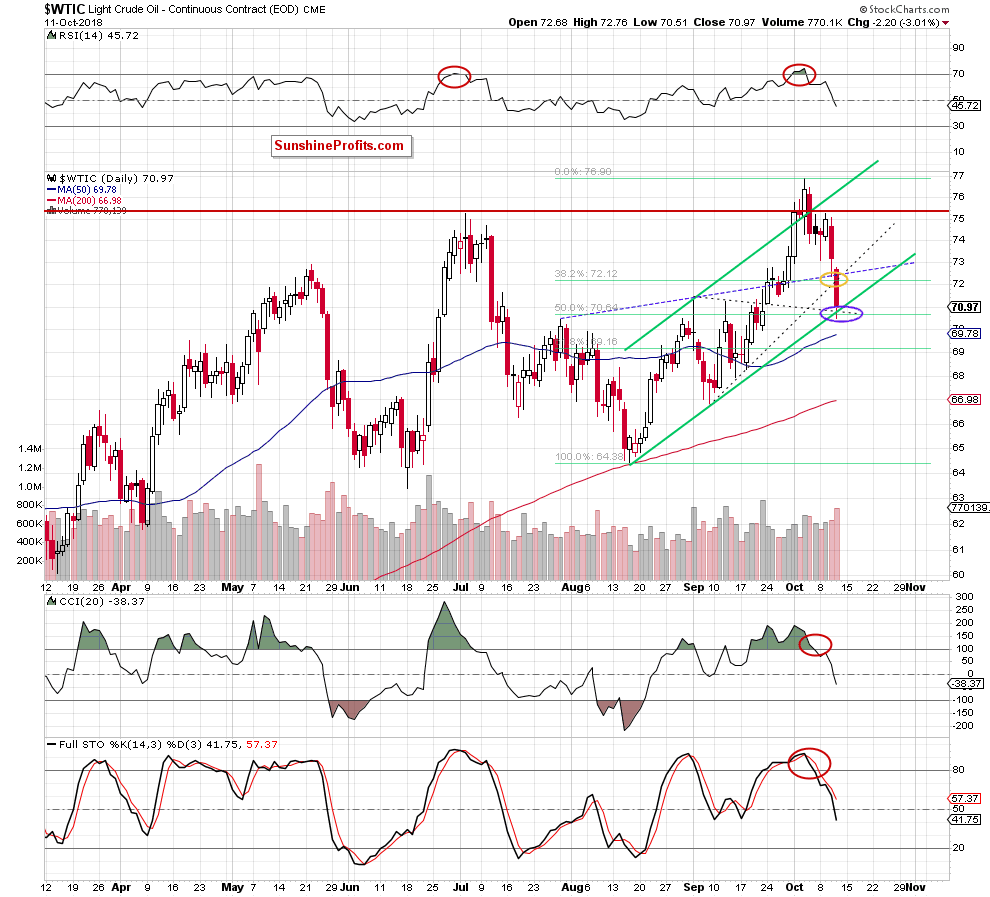
Before we answer this question, let's recall the quotes from yesterday's alert:
(…) taking into account the above-mentioned long-term picture of light crude, the sell signals generated by the daily indicators and yesterday’s volume (it was bigger than day earlier during Tuesday’s rebound), we think that further deterioration is just around the corner.
How low can the price of crude oil go in the coming days?
In our opinion, if the bears manage to extend Wednesday decline, we’ll see a drop to the next support area (marked with the purple ellipse) in the following days. At this point it is worth noting that this area is created by the upper line of the black dotted triangle, the 50% Fibonacci retracement and the lower border of the green rising trend channel. Therefore, if it is broken the way to lower levels will be open.
On the daily chart, we see that oil bears realized the above-mentioned plan very quickly (only one session was enough to reach the next target), which confirms their strength –
especially when we factor in yesterday’s volume (it was the biggest volume since September 21, which shows the commitment of the sellers).
Nevertheless, we should keep in mind that the mentioned zone is based on strong supports, which can result in a rebound later in the day (at the moment of writing this alert the crude oil futures moved to $71.50).
On the other hand, the sell signals generated by the daily, weekly and even monthly indicators and all described technical factors remain in the cards, supporting oil bears in further battle for lower prices of black gold. Therefore, we will probably see lower prices in the following weeks, but a quick rebound here appears quite likely as well.
Want free follow-ups to the above article and details not available to 99%+ investors? Sign up to our free newsletter today!
Author

Przemyslaw Radomski, CFA
Sunshine Profits
Przemyslaw Radomski, CFA (PR) is a precious metals investor and analyst who takes advantage of the emotionality on the markets, and invites you to do the same. His company, Sunshine Profits, publishes analytical software that any


