News Tsunami Dead Ahead [Video]
![News Tsunami Dead Ahead [Video]](https://editorial.fxstreet.com/images/Markets/Equities/stock-market-surge-bull-green-financial-screen-5785196_XtraLarge.jpg)
US Dollar: June USD is Up at 96.575.
Energies: May '19 Crude is Down at 64.22.
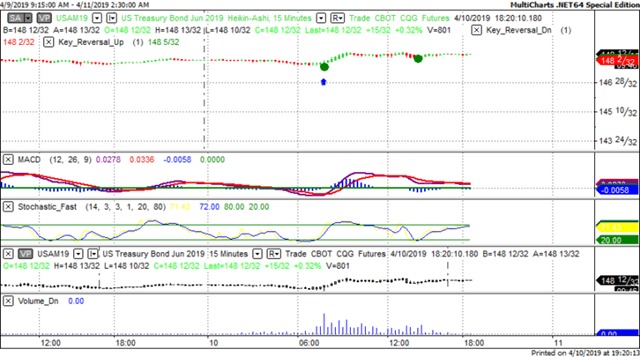
Financials: The Jun 30 year bond is Up 2 ticks and trading at 148.09.
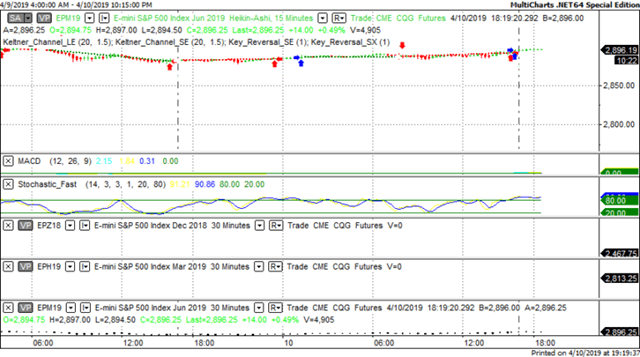
Indices: The June S&P 500 emini ES contract is 10 ticks Lower and trading at 2892.00.
Gold: The June Gold contract is trading Down at 1307.60 Gold is 63 ticks Lower than its close.
Initial Conclusion
This is not a correlated market. The dollar is Up+ and Crude is Down- which is normal and the 30 year Bond is trading Higher. The Financials should always correlate with the US dollar such that if the dollar is lower then bonds should follow and vice-versa. The S&P is Lower and Crude is trading Lower which is not correlated. Gold is trading Lower which is correlated with the US dollar trading Up. I tend to believe that Gold has an inverse relationship with the US Dollar as when the US Dollar is down, Gold tends to rise in value and vice-versa. Think of it as a seesaw, when one is up the other should be down. I point this out to you to make you aware that when we don't have a correlated market, it means something is wrong. As traders you need to be aware of this and proceed with your eyes wide open.
At this hour Asia is trading mainly Lower with the exception of the Nikkei exchange which is fractionally Higher. Currently all of Europe is trading Lower with the exception of the Paris exchange which is fractionally Higher.
Possible Challenges To Traders Today
-
PPI is out at 8:30 AM EST. This is major.
-
Core PPI is out at 8:30 AM EST. This is major.
-
Unemployment Claims are out at 8:30 AM EST. This is major.
-
FOMC Member Clarida Speaks at 9:30 AM EST. This is major.
-
FOMC Member Williams Speaks at 9:35 AM EST. This is major.
-
FOMC Member Bullard Speaks at 9:40 AM EST. This is major.
-
Natural Gas Storage is out at 10:30 AM EST. This is major.
-
30-y Bond Auction starts at 1 PM EST. Major
-
FOMC Member Bowman Speaks at 4 PM EST. This is major.
Treasuries
We've elected to switch gears a bit and show correlation between the 30 year bond (ZB) and The YM futures contract. The YM contract is the DJIA and the purpose is to show reverse correlation between the two instruments. Remember it's liken to a seesaw, when up goes up the other should go down and vice versa.
Yesterday the ZB made a major move at around 8 AM EST. The ZB hit a Low at around that time and the YM hit a High. If you look at the charts below ZB gave a signal at around 8 AM EST and the YM was moving Lower at the same time. Look at the charts below and you'll see a pattern for both assets. ZB hit a Low at around 8 AM and the YM was moving Lower at the same time. These charts represent the newest version of MultiCharts and I've changed the timeframe to a 15 minute chart to display better. This represented a Long opportunity on the 30 year bond, as a trader you could have netted about 15 ticks per contract on this trade. Each tick is worth $31.25. Please note: the front month for the ZB contract is now June, 2019
Charts Courtesy of MultiCharts built on an AMP platform.
Bias
Yesterday we gave the markets a Neutral bias as the indices didn't seem to have any sense of direction yesterday morning. The Dow gained about 7 points and the other indices gained ground as well. Today we aren't dealing with a correlated market and our bias is to the Downside.
Could this change? Of Course. Remember anything can happen in a volatile market.
Commentary
Yesterday morning we were faced with a news tsunami as we are today. The news reported yesterday wasn't terrible and we hope the same will prevail in today's session. We are faced with a news tsunami as the markets will release about 9 economic reports, all of which are major. Of those 9 being reported, 3 are FOMC members speaking at 3 different locations. They could all be saying the same thing or have different opinions; but of course only time will tell.
Author

Nick Mastrandrea
Market Tea Leaves


