New Record Highs Ahead?

Stocks were mixed yesterday, as investors continued to hesitate following the recent advance. The S&P 500 index remains relatively very close to its late August new record high of 2,916.50. Will it break above that high? Or is this some topping pattern ahead of a downward reversal?
The U.S. stock market indexes were mixed between -0.1% and +0.6% on Wednesday, extending their short-term fluctuations, as investors' sentiment remained unchanged. The S&P 500 index has reached the record high of 2,916.50 on August the 29th. It currently trades just 0.5% below that high. The Dow Jones Industrial Average gained 0.6% and the technology Nasdaq Composite lost 0.1% yesterday.
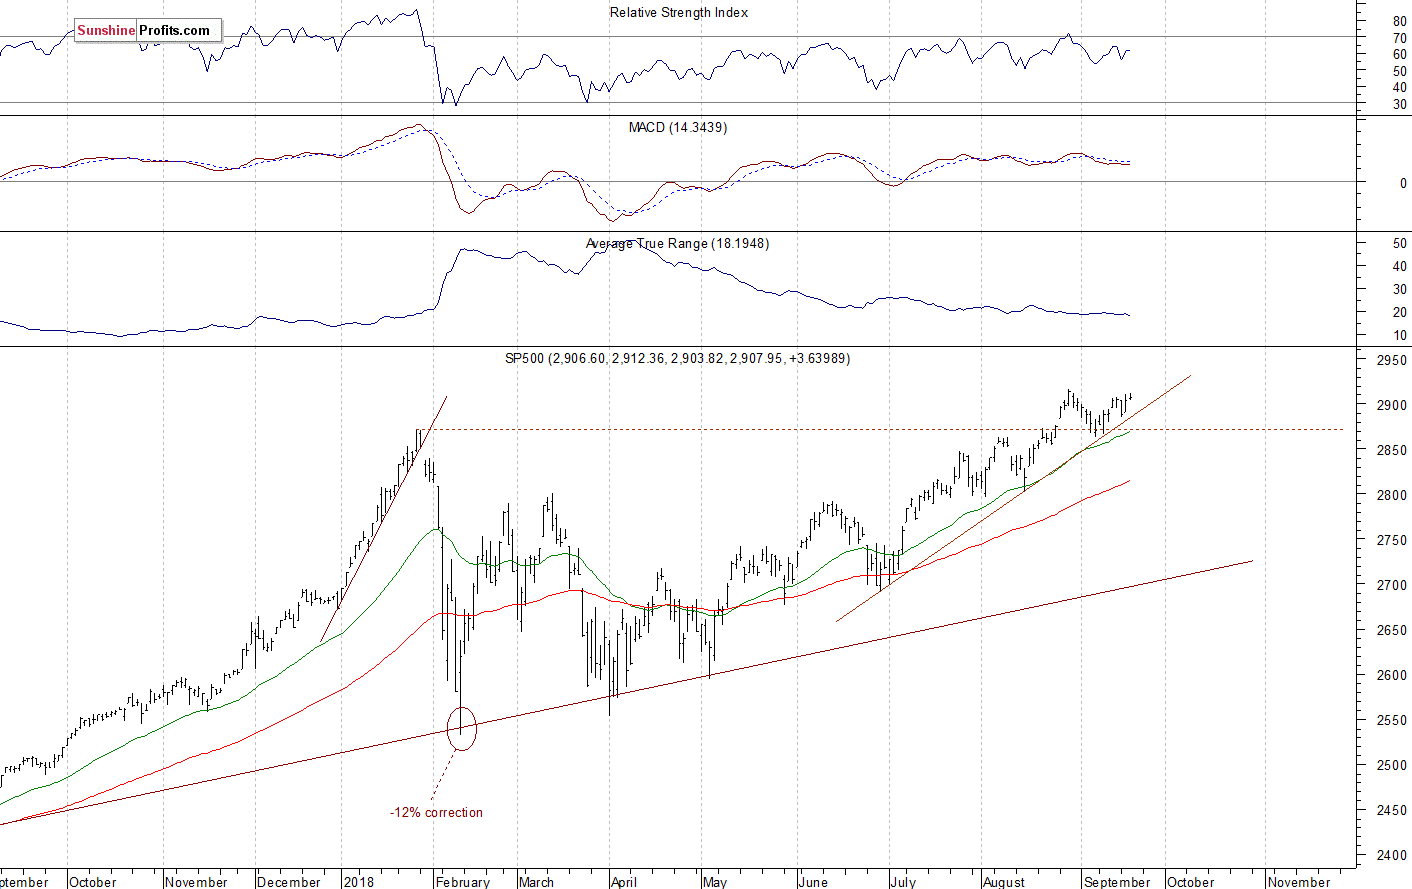
The nearest important level of support of the S&P 500 index remains at 2,900. The next support level is at around 2,880, marked by the recent local low. The support level is also at around 2,860-2,865. On the other hand, the nearest important level of resistance is now at 2,910-2,915, marked by the mentioned record high.
The broad stock market reached the new record high in the late August, as it extended its short-term uptrend above the level of 2,900. Since then it trades within a consolidation. On Tuesday, it got back above 2,900 mark again. Will it advance towards new all-time highs? Or is this some medium-term topping pattern? The index trades above its three-month-long upward trend line, as we can see on the daily chart:
Still Close to Record High
The index futures contracts trade 0.1% higher vs. their Wednesday's closing prices. So expectations before the opening of today's trading session are virtually flat again. The European stock market indexes have gained 0.2-0.7% so far. Investors will wait for some economic data announcements this morning: Philadelphia Fed Manufacturing Index, Initial Claims at 8:30 a.m., Leading Indicators, Existing Home Sales at 10:00 a.m. The broad stock market may continue to fluctuate within a short-term consolidation along the level of 2,900. For now, it looks like another relatively flat correction within a medium-term uptrend. There have been no confirmed negative signals so far.
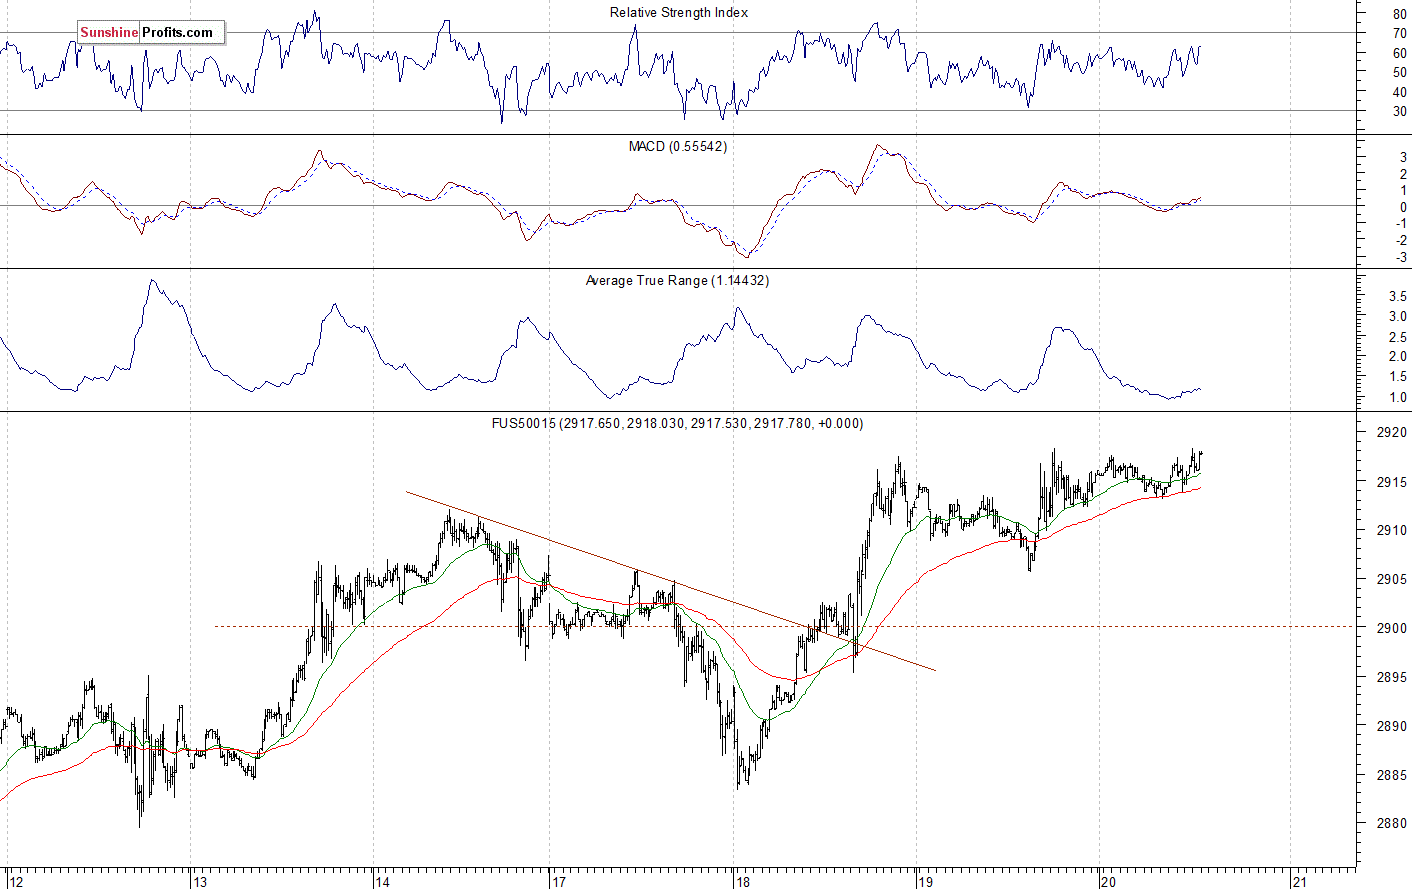
The S&P 500 futures contract trades within an intraday consolidation, as it remains close to its record high. The nearest important level of resistance is at around 2,917-2,920. On the other hand, support level is at 2,900-2,905, marked by the recent local low. The level of support is also at around 2,880-2,890. The futures contract trades along its record high, as the 15-minute chart shows:
Nasdaq Going Sideways
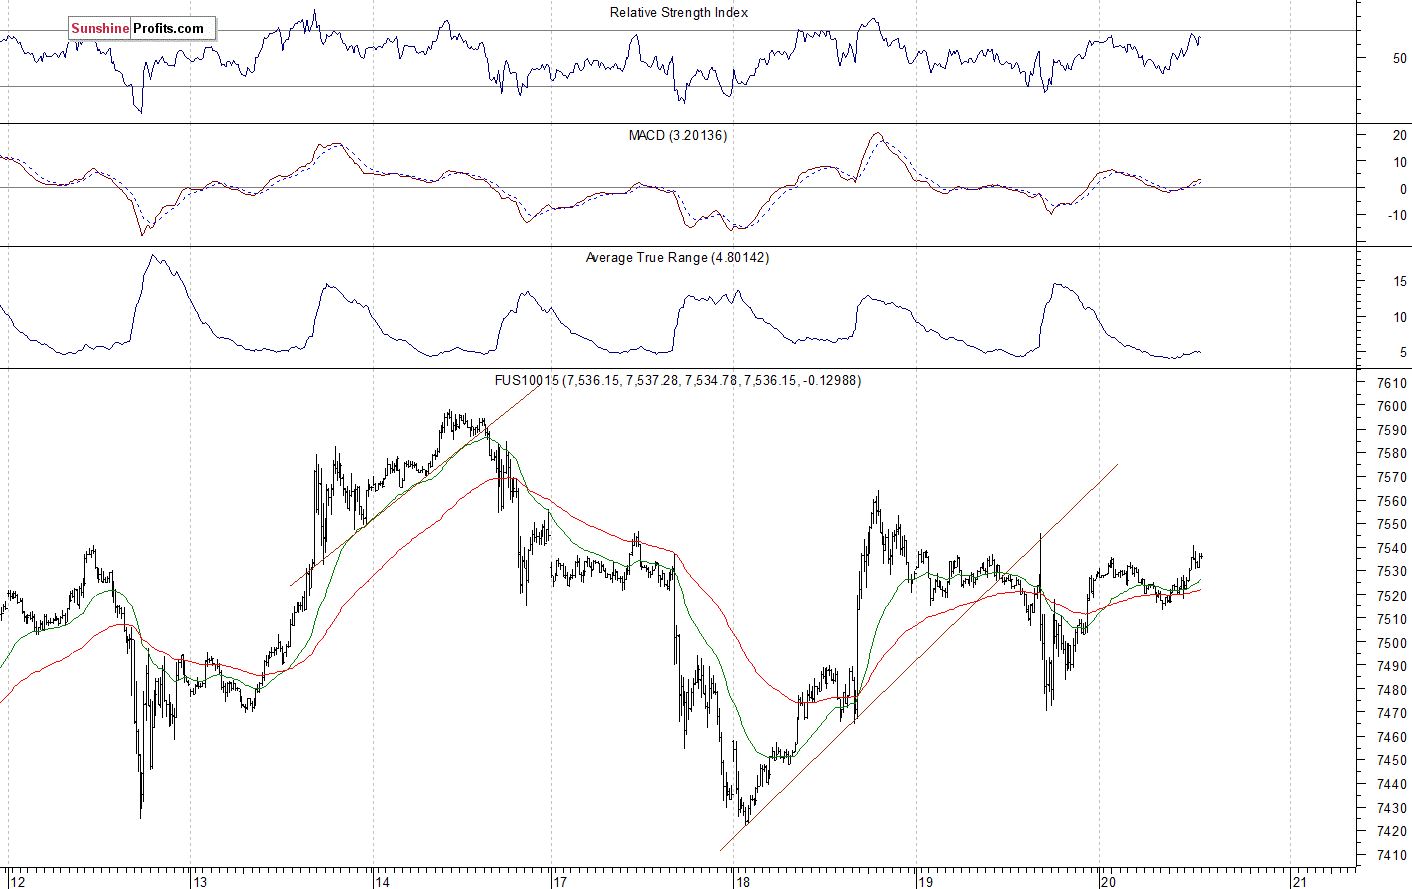
The technology Nasdaq 100 futures contract follows a similar path, as it extends its short-term fluctuations. However, the tech stocks' gauge remains way below its late August record high. It is relatively weaker than the broad stock market following almost 4% downward correction off the August the 30th record high of around 7,700. The nearest important level of resistance is at around 7,530-7,550, marked by the short-term local highs. The next resistance level is at 7,600. On the other hand, support level is at 7,470-7,500, among others. The Nasdaq futures contract extends its short-term consolidation, as we can see on the 15-minute chart:
Big Cap Tech Stocks at Support Levels
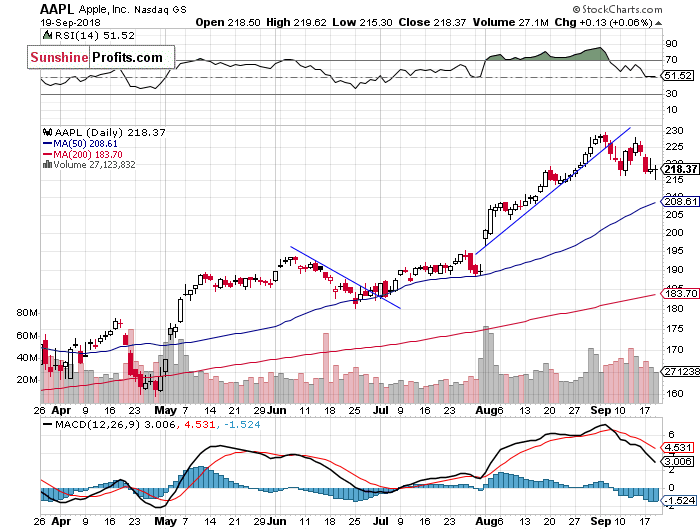
Let's take a look at Apple, Inc. stock (AAPL) daily chart. It reached the new record high at the level of $229.67 on September the 5th, before reversing lower. Then it broke below its month-long upward trend line. The resistance level remains at $225-230. On the other hand, support level is at $215. If the price breaks lower, we could see more selling pressure:
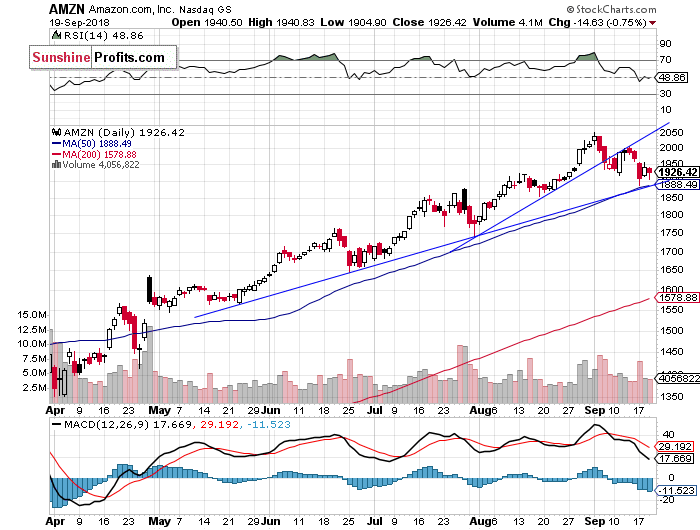
Now let's take a look at Amazon.com, Inc. stock (AMZN) daily chart. It has reached the new record high at the price of $2,050.50 recently. Since then it was retracing this record-breaking rally. The stock broke below the month-long upward trend line in the early September. We still can see negative technical divergences. Last Tuesday's intraday reversal didn't lead the market above the resistance level of $2,000. The price is at its medium-term upward trend line:
Dow Jones Continues Higher
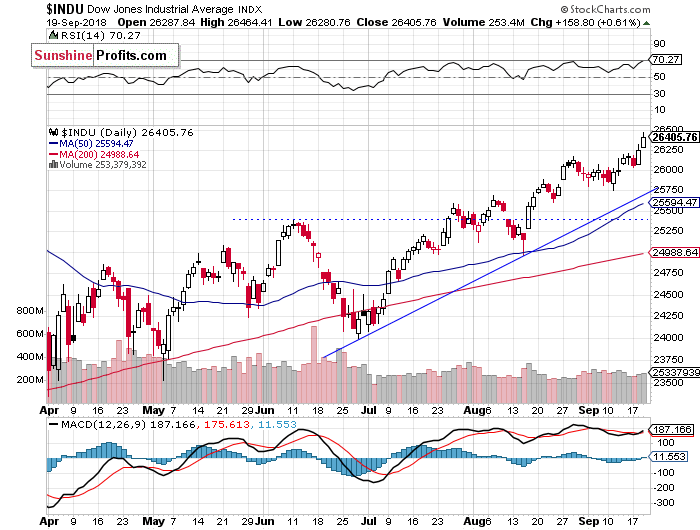
The Dow Jones Industrial Average extended its short-term uptrend yesterday, as it got closer to the level of 26,500. The blue-chip stocks' gauge broke above its late August local high last week. The nearest important level of resistance is at 26,340-26,440, marked by the late January daily gap down. The index trades above its two-month long upward trend line, as the daily chart shows:
The S&P 500 index reached the new record high at the level of 2,916.50 last month. Since then the broad stock market's gauge is fluctuating along the level of 2,900. There have been no confirmed negative signals so far. However, we still can see some short-term technical overbought conditions along with negative technical divergences.
Concluding, the S&P 500 index will likely open virtually flat today. The market is still very close to its late August record high, so we may see an attempt at extending the bull market.
Want free follow-ups to the above article and details not available to 99%+ investors? Sign up to our free newsletter today!
Author

Paul Rejczak
Sunshine Profits
Paul Rejczak is a stock market strategist who has been known for the quality of his technical and fundamental analysis since the late nineties.


