New Correction Underway

Market Overview
The term “correction” is meaningless, unless you can specify its size or duration. I have found that a Point & Figure count in conjunction with Fibonacci analysiscan give us a fairly good idea of what to expect, especially since they tend to confirm each other. While the measurement is not always one hundred percent accurate, and may occasionally require some adjustment, it’s close enough to be extremely worthwhile. For that matter, the same methodcan be applied to determine the potential of rallies.
In this case, 2860 (+ or – a couple of points) carried a high probability of being the extreme potential for the rally from 2692, before a correction set in. The high came in last week at 2863 followed by a period of distribution which lasted until the last hour on Thursday. I’ll discuss its potential projection in thechart analysis section.
Since higher counts can be obtained from the base which formed after the correction from the January top, this isonly expected to be an interim high and not the top or the bull market, but the latter is drawing ever nearer with perhaps less than 200 points remaininginthe SPX bull market.
Chart analysis (The charts that are shown below are courtesy of QCharts)
SPX daily chart
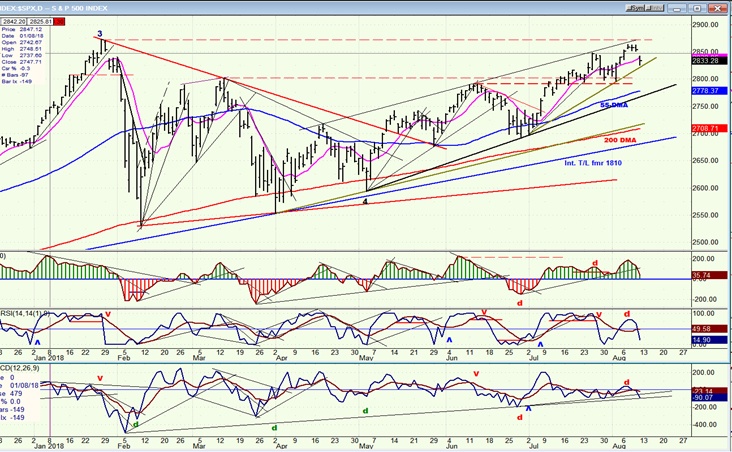
The last short-term high in the uptrend from 2692 found resistance at the top of its channel line, and there was a brief and shallow pull-back to good support before another small base was created which gave an additional count to ~2860. Since this matched a base count from the 2600 level, as well as projection targets fromre-accumulation patterns in late May and June, another correction was expected afterlast week’s high was reached.
Warnings also came from the lower two oscillators which produced negative divergence when that price level was reached.These have already given a sell signal, but it will have to be confirmed by the top oscillator going negative as the index breaks its short-term uptrend line.
This correction is unlikely to go below the 55-dma and corresponding trend line at this time, but let’s see if this is confirmed by P&F and Fibonacci measurements. The amount of distribution created last week gives us a maximum count of 2813, which could be all we get, but it appears to be a little shallow since a .382 retracement of the entire rally from 2692 should bring the SPX down to 2798. This suggests that a move to 2813 may only be the end of the first phase of the correction and, after some additional re-distribution, we could move down closer tothe Fib target. The action over the next week or so should bring more clarity.
SPX hourly chart
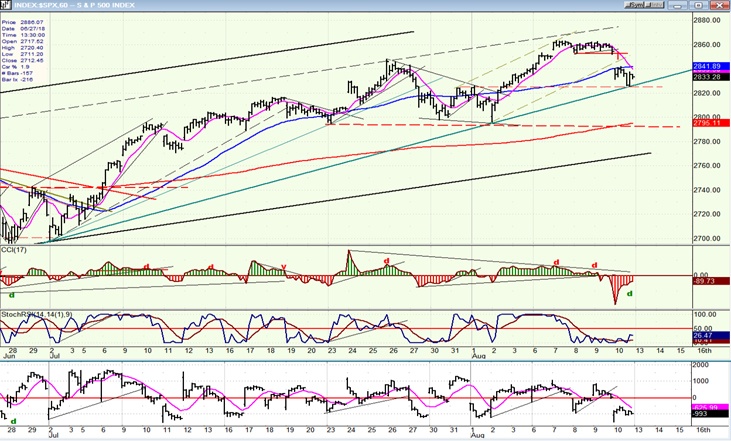
The hourly chart shows an unusually clear distribution pattern which formed after the index made its high of 1863. This was followed by the breaking of minor support and a large opening gap to start the correction process. The first drop was to the uptrend line from the 2692 low which combined with a minor support level to give us our first bounce in a downtrend. As if the distribution process was not clear enough, the double divergence in the oscillators did not leave much doubt that this is what was about to take place.
That uptrend line is nearly certain to be broken as the decline continuesat least 10 points lower to fill the count established at the top. But, as mentioned above, it is doubtful that this will mark the end of the correction since even that lower level would still be shy of a .382 retracement of the rally’s uptrend. More likely, after a counter-trend bounce, the correction will continue to approximately the same level where the last correction found support(dashed red lines).
A small cycle low is expected on Monday morning, although it could have come a couple of hours early, on Friday.But that was probably only a bounce from the trend line.
This is what I glean from the market’s action going into Friday’s close. If the activity going forwardconflicts with this analysis, I’ll address the change of perspective in the daily updates.
SPX, NDX,IWM (daily)
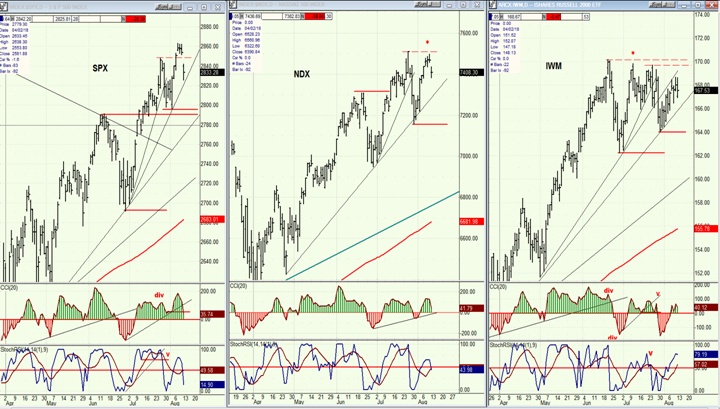
This week, I want to compare the action of SPX, NDX, and IWM. It should give us additional insight on what the market is doing. IWM, which has a reputation as a market leader, started to diverge from SPXfive weeks ago; NDX only last week. The market was thus giving us a warning that it was ready for a correction. I should add that I have started to keep a P&F chart on NDX.It shows that the index had filled its count from the June base at 7400 last week,while SPX chose to go an extra ten points.
Since the middle of June, IWM has been making a broad congestion pattern -- which is probably accumulation rather than distribution, since there are still higher counts for SPX. In that case,as a leader, it should emerge from this formation on the upside and make new highs ahead of the other two indexes, thereby signaling the end of this correction and the beginning of a rally to new highs for SPX and NDX.
The DOW, which has been lagging more and more, will have to do some fancy foot work to catch up!SPX only needs 40 points to reach its all-time high The DJIA needs 1300 points.
UUP (dollar ETF) daily
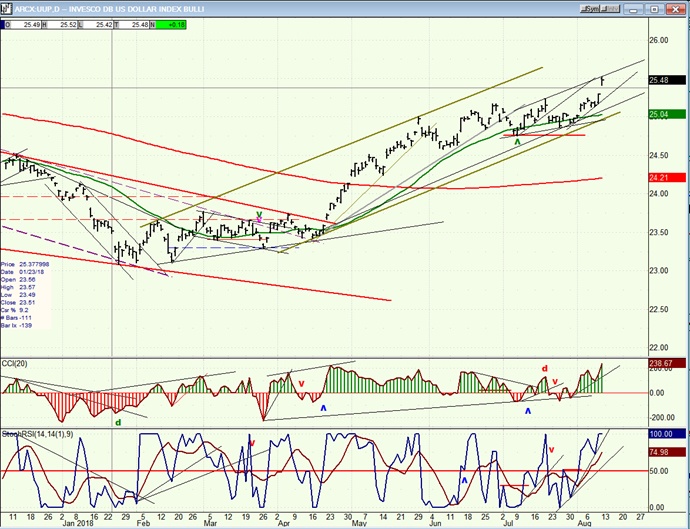
UUP made a new high last week and finally reached the 25.50 target that had been suggested by its P&F chart. That does not mean that it will stop on a dime and start to reverse immediately. But this cannot take too long, because it sure looks like this last push was the end of the wave which started at 24.87. It also looks like the end of the move which started from 25.14.
Nor does it mean that we have seen the final high in UUP. There could be a correction of a few days (or longer) followed by one more and final high which would complete a 5-wave pattern from early July.
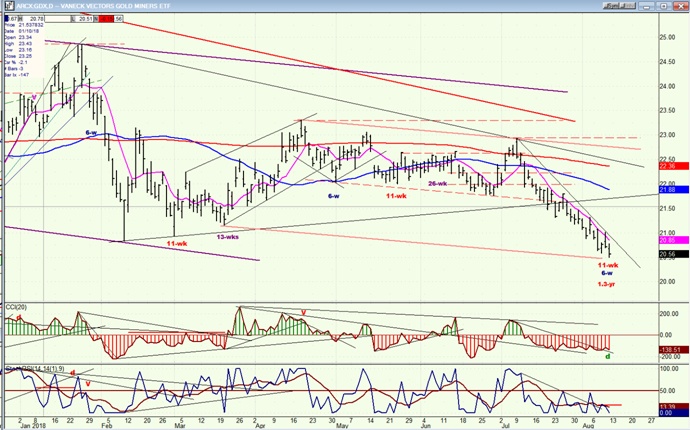
GDX (Gold miners ETF)
GDX may quickly confirm that UUP is making at least a near-term top. If I am correct, there is a cluster of cycles all making their lows around this time frame. A daily close above 21.00 continuing beyond 21.50 could ensure a continuation to 23.00, for a start.
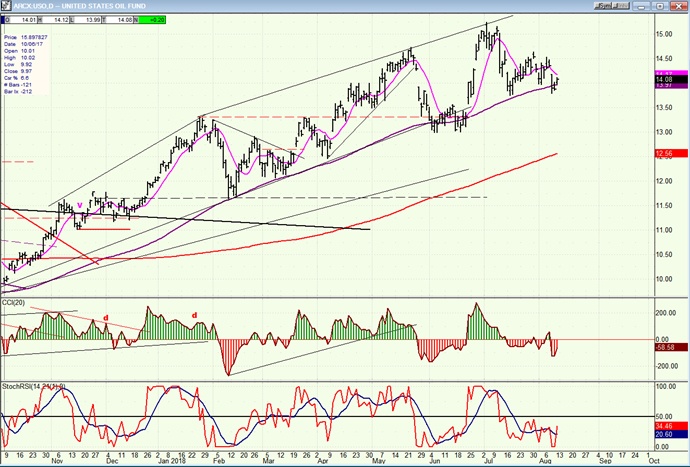
USO (United States Oil Fund)
USO continues its correction and could be vulnerable to a retracement to the previous short-term base, at about 13.00.
Summary
Everything points to the index having started a short-term correction which could cause a retracement to about 2795. While this is what it only appears to be at this time, I may have to change my mind if IWM starts to trade below 163.
Author

Andre Gratian
Market Turning Points
When I was a stock broker years ago, a friend introduced me to technical analysis of the market and it is not an exaggeration to say that I fell in love with this approach! Ever since then, it has become an increasingly important


