Cloud computing is one of the sectors that have vastly outperformed the marketplace since the March 2020 low.  NetEase Inc is in the cloud computing business, focused on community, communications, commerce and video games.  Lets take a more detailed look at their operations:

“NetEase, Inc. is a Chinese Internet technology company providing online services centered on content, community, communications and commerce. The company was founded in 1997 by Ding Lei.  NetEase develops and operates online PC and mobile games, advertising services, email services and e-commerce platforms in China. It is one of the largest Internet and video game companies in the world. The company also owns several pig farms.

Some of NetEase’s games include the Westward Journey series (Fantasy Westward Journey, Westward Journey Online II, Fantasy Westward Journey II, and New Westward Journey Online II), as well as other games, such as Tianxia III, Heroes of Tang Dynasty Zero and Ghost II. NetEase also partners with Blizzard Entertainment to operate local versions of Warcraft III, World of Warcraft, Hearthstone, StarCraft II, Diablo III: Reaper of Souls, Overwatch in China, the RPG game Onmyoji, and the Onmyoji Arena MOBA. They are also developing their first self-developed VR multiplayer online game with an open world setting, which is called Nostos.”

NetEase is counting clean off the March 2020 all time low low, lets take a look at the 4H chart below.

NetEase Weekly Elliott Wave View

NTES

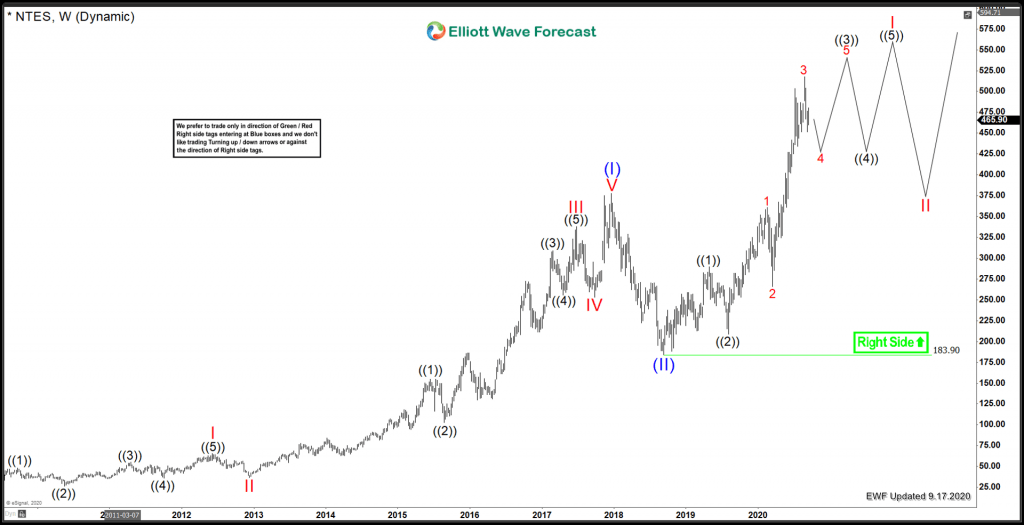
On a Weekly Time Frame.  From the all time lows, NetEase has a great looking structure that favours further extension higher in the future.  There is a clear 5 waves structure leading into the 2017 high labeled Blue (I).  This high was struck at 377.62 in December 2017.    After that,  a multi month correction took place for blue (II).  That low was struck at 183.90 in September of 2018.  From there NetEase formed a series of nesting ((1))-((2)) and Red 1-2, leading into the recent peak. Lets zoom in a bit and take a look at the daily chart from those Blue (II) lows.

NetEase Daily Elliott Wave View

Chart

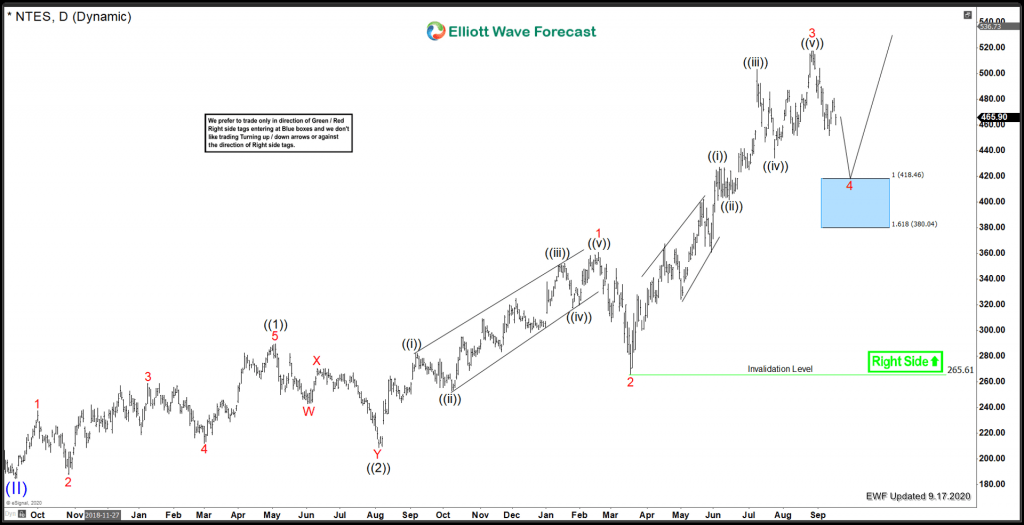
On a daily view, NetEase shows a series of nests with Black ((1)) and ((2)) set, and Red 1 and 2 set.  Red 2 bottomed at the March 2020 low.  After that, Red 3 has formed an impulse into the recent peak that was seen on August 24th, at 517.65.  Currently, prices are favoured to be pulling back in Red 4, which is presently favoured as a buying opportunity.  There is a blue box extreme area where buyers may show up for a bounce in 3 waves at least in Red 4.  This runs from 418.46 to 380.04.  There is an incomplete bullish sequence to the upside, which favours more upside in the future.

In conclusion, Red 3 is favoured to be set, with Red 4 ongoing.  The blue box price area may change if NetEase manages to get a bigger bounce before moving down.  But for now, that blue box remains the area where buyers may show up for a bounce in 3 waves at least.

FURTHER DISCLOSURES AND DISCLAIMER CONCERNING RISK, RESPONSIBILITY AND LIABILITY Trading in the Foreign Exchange market is a challenging opportunity where above average returns are available for educated and experienced investors who are willing to take above average risk. However, before deciding to participate in Foreign Exchange (FX) trading, you should carefully consider your investment objectives, level of xperience and risk appetite. Do not invest or trade capital you cannot afford to lose. EME PROCESSING AND CONSULTING, LLC, THEIR REPRESENTATIVES, AND ANYONE WORKING FOR OR WITHIN WWW.ELLIOTTWAVE- FORECAST.COM is not responsible for any loss from any form of distributed advice, signal, analysis, or content. Again, we fully DISCLOSE to the Subscriber base that the Service as a whole, the individual Parties, Representatives, or owners shall not be liable to any and all Subscribers for any losses or damages as a result of any action taken by the Subscriber from any trade idea or signal posted on the website(s) distributed through any form of social-media, email, the website, and/or any other electronic, written, verbal, or future form of communication . All analysis, trading signals, trading recommendations, all charts, communicated interpretations of the wave counts, and all content from any media form produced by www.Elliottwave-forecast.com and/or the Representatives are solely the opinions and best efforts of the respective author(s). In general Forex instruments are highly leveraged, and traders can lose some or all of their initial margin funds. All content provided by www.Elliottwave-forecast.com is expressed in good faith and is intended to help Subscribers succeed in the marketplace, but it is never guaranteed. There is no “holy grail” to trading or forecasting the market and we are wrong sometimes like everyone else. Please understand and accept the risk involved when making any trading and/or investment decision. UNDERSTAND that all the content we provide is protected through copyright of EME PROCESSING AND CONSULTING, LLC. It is illegal to disseminate in any form of communication any part or all of our proprietary information without specific authorization. UNDERSTAND that you also agree to not allow persons that are not PAID SUBSCRIBERS to view any of the content not released publicly. IF YOU ARE FOUND TO BE IN VIOLATION OF THESE RESTRICTIONS you or your firm (as the Subscriber) will be charged fully with no discount for one year subscription to our Premium Plus Plan at $1,799.88 for EACH person or firm who received any of our content illegally through the respected intermediary’s (Subscriber in violation of terms) channel(s) of communication.

Recommended Content


Recommended Content

Editors’ Picks

USD/JPY holds above 155.50 ahead of BoJ policy announcement

USD/JPY holds above 155.50 ahead of BoJ policy announcement

USD/JPY is trading tightly above 155.50, off multi-year highs ahead of the BoJ policy announcement. The Yen draws support from higher Japanese bond yields even as the Tokyo CPI inflation cooled more than expected. 

USD/JPY News

AUD/USD consolidates gains above 0.6500 after Australian PPI data

AUD/USD consolidates gains above 0.6500 after Australian PPI data

AUD/USD is consolidating gains above 0.6500 in Asian trading on Friday. The pair capitalizes on an annual increase in Australian PPI data. Meanwhile, a softer US Dollar and improving market mood also underpin the Aussie ahead of the US PCE inflation data. 

AUD/USD News

Gold price keeps its range around $2,330, awaits US PCE data

Gold price keeps its range around $2,330, awaits US PCE data

Gold price is consolidating Thursday's rebound early Friday. Gold price jumped after US GDP figures for the first quarter of 2024 missed estimates, increasing speculation that the Fed could lower borrowing costs. Focus shifts to US PCE inflation on Friday. 

Gold News

Stripe looks to bring back crypto payments as stablecoin market cap hits all-time high

Stripe looks to bring back crypto payments as stablecoin market cap hits all-time high

Stripe announced on Thursday that it would add support for USDC stablecoin, as the stablecoin market exploded in March, according to reports by Cryptocompare.

Read more

US economy: Slower growth with stronger inflation

US economy: Slower growth with stronger inflation

The US Dollar strengthened, and stocks fell after statistical data from the US. The focus was on the preliminary estimate of GDP for the first quarter. Annualised quarterly growth came in at just 1.6%, down from the 2.5% and 3.4% previously forecast.

Read more

Majors

Cryptocurrencies

Signatures