Murrey Math Lines: USD/CHF, Gold

USD/CHF, “US Dollar vs Swiss Franc”
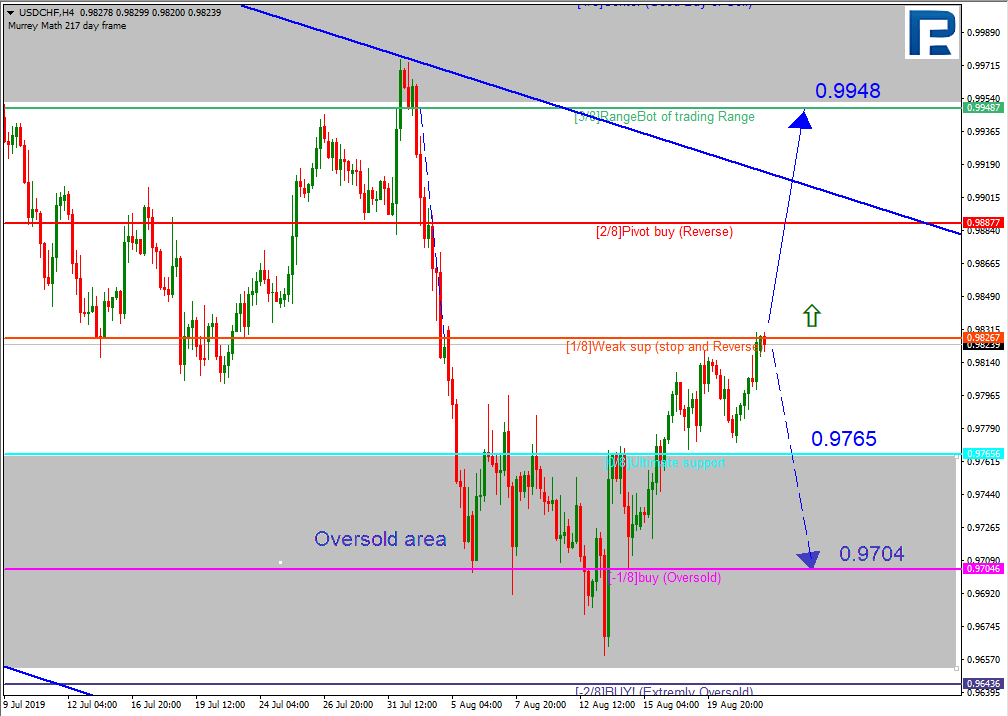
As we can see in the H4 chart, USDCHF is no longer moving inside the “oversold area”. In this case, the pair may break 2/8 and continue growing towards the resistance at 3/8. However, this scenario may no longer be valid if the price rebounds from 2/8. After that, the instrument may continue falling towards the support at -1/8.
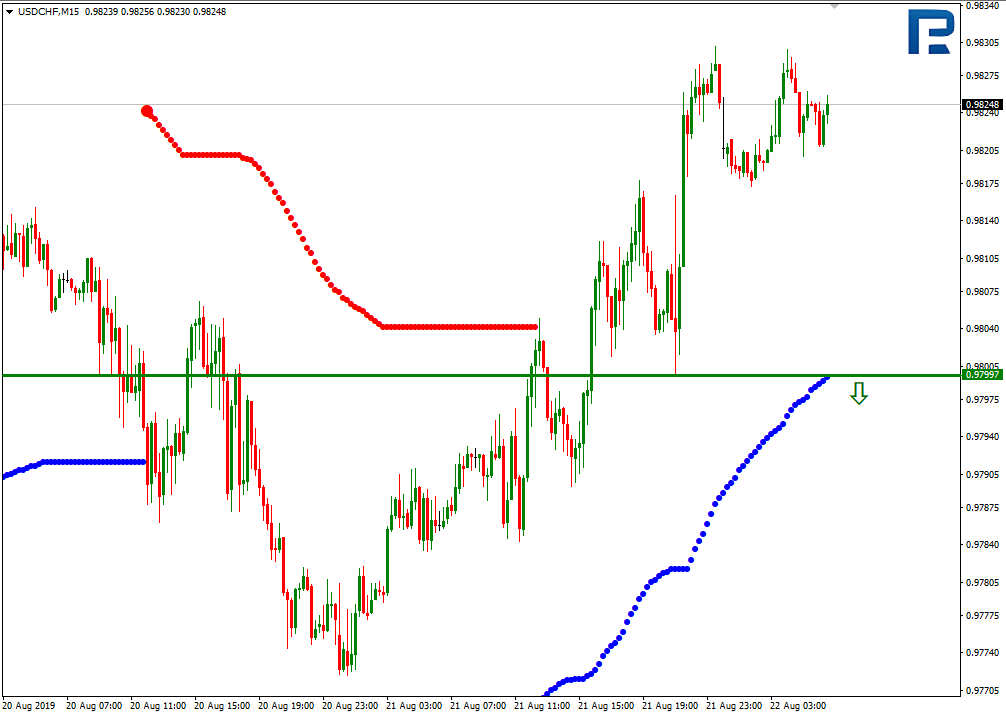
In the M15 chart, the pair may break the downside line of the VoltyChannel indicator and, as a result, continue moving downwards.
XAU/USD, “Gold vs US Dollar”
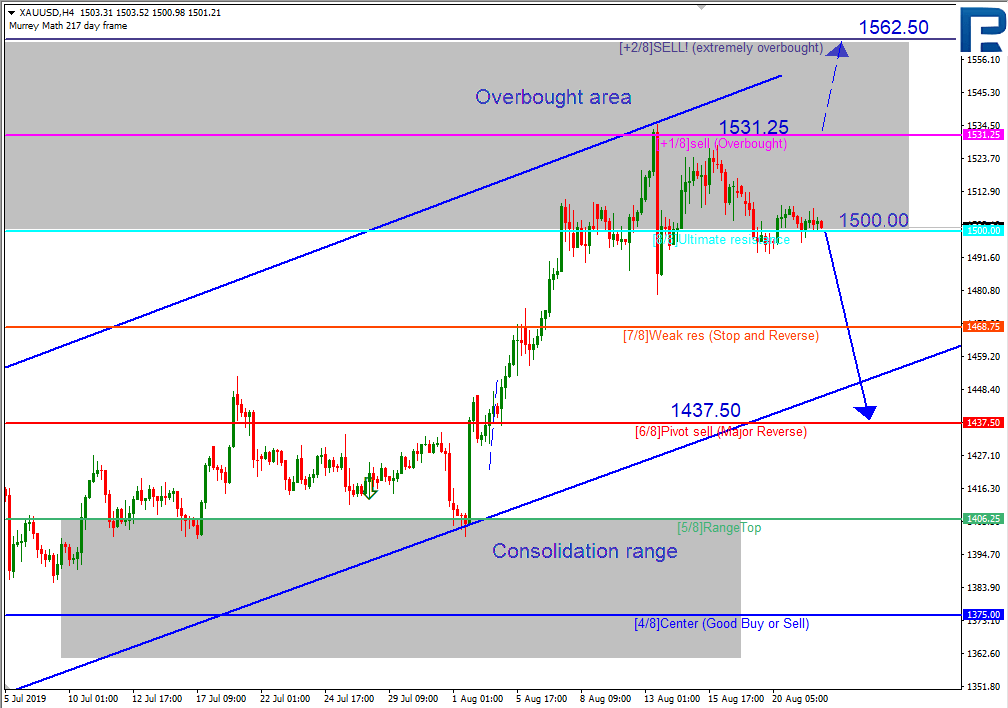
As we can see in the H4 chart, XAUUSD is still trading inside the “overbought area”. In this case, the price is expected to break 8/8 and then resume falling to reach the support at 6/8. However, this scenario may no longer be valid if the price breaks +1/8. After that, the instrument may continue growing towards the resistance at +2/8.
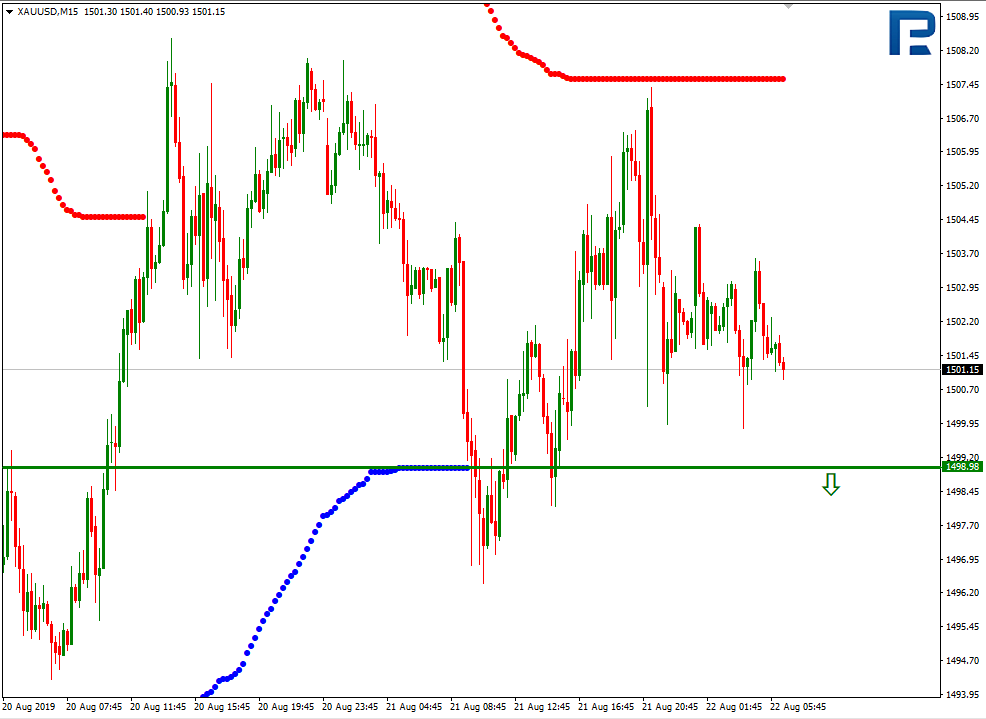
In the M15 chart, the pair may break the downside line of the VoltyChannel indicator and, as a result, continue moving downwards to reach 6/8 from the H4 chart.
Author

RoboForex Team
RoboForex
RoboForex Team is a group of professional financial experts with high experience on financial market, whose main purpose is to provide traders with quality and up-to-date market information.


