Mixed eco news: Mixed day [Video]
![Mixed eco news: Mixed day [Video]](https://editorial.fxstreet.com/images/Markets/Bonds/Bond/united-states-treasury-ee-savings-bond-horizontal-close-up-16314912_XtraLarge.jpg)
US Dollar: Dec '21 USD is Down at 93.630.
Energies: Dec '21 Crude is Up at 82.80.
Financials: The Dec '21 30 Year bond is Down 1 tick and trading at 157.24.
Indices: The Dec '21 S&P 500 Emini ES contract is 14 ticks Lower and trading at 4538.25.
Gold: The Dec'21 Gold contract is trading Up at 1793.50. Gold is 116 ticks Higher than its close.
Initial conclusion
This is not a correlated market. The dollar is Down and Crude is Up which is normal and the 30 year Bond is trading Lower. The Financials should always correlate with the US dollar such that if the dollar is lower then bonds should follow and vice-versa. The S&P is Lower and Crude is trading Higher which is correlated. Gold is trading Higher which is correlated with the US dollar trading Down. I tend to believe that Gold has an inverse relationship with the US Dollar as when the US Dollar is down, Gold tends to rise in value and vice-versa. Think of it as a seesaw, when one is up the other should be down. I point this out to you to make you aware that when we don't have a correlated market, it means something is wrong. As traders, you need to be aware of this and proceed with your eyes wide open. Currently, Asia is trading Higher with the exception of the Shanghai and Sensex exchanges. All of Europe is trading Higher with the exception of the Spanish IBEX.
Possible challenges to traders today
-
Flash Manufacturing PMI is out at 9:45 AM EST. This is Major.
-
Flash Services PMI is out at 9:45 AM EST. This is Major.
-
FOMC Member Daly Speaks at 10 AM EST. This is Major.
-
Fed Chair Powell Speaks out at 11 AM EST. This is Major.
-
Federal Budget Balance is Major. No Timeframe for release.
-
Treasury Currency Report is Major. No Timeframe for release.
Treasuries
Traders, please note that we've changed the Bond instrument from the 30 years (ZB) to the 10 years (ZN). They work exactly the same.
We've elected to switch gears a bit and show a correlation between the 10-year bond (ZN) and The S&P futures contract. The S&P contract is the Standard and Poor's and the purpose is to show reverse correlation between the two instruments. Remember it's likened to a seesaw, when up goes up the other should go down and vice versa.
Yesterday the ZN made its move at around 9 AM EST. The ZN hit a High at around that time and the S&P moved Higher. If you look at the charts below ZN gave a signal at around 9 AM EST and the S&P moved Higher at around the same time. Look at the charts below and you'll see a pattern for both assets. ZN hit a High at around 9 AM EST and the S&P was moving Higher shortly thereafter. These charts represent the newest version of MultiCharts and I've changed the timeframe to a 15-minute chart to display better. This represented a Shorting opportunity on the 10-year note, as a trader you could have netted about 16 ticks per contract on this trade. Each tick is worth $15.625. Please note: the front month for the ZN is now Dec '21. The S&P contract is now Dec '21 as well. I've changed the format to Renko bars such that they may be more apparent and visible.
Charts Courtesy of MultiCharts built on an AMP platform
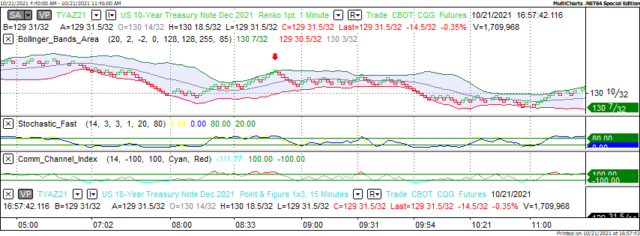
ZN - Dec 2021 - 10/21/21
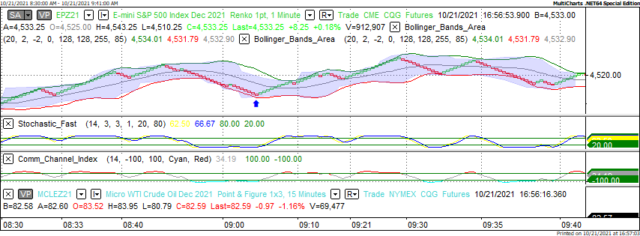
S&P - Dec 2021 - 10/21/21
Bias
Yesterday we gave the markets a Downside bias as the USD and Gold were both trading Higher and this usually doesn't bode well for an Upside day hence the Downside bias. The Dow traded Lower by 6 points but the S&P and Nasdaq both closed Higher. Today we aren't dealing with a correlated market and our bias is Neutral or Mixed.
Could this change? Of Course. Remember anything can happen in a volatile market.
Commentary
Yesterday the news report wasn't stellar but in fact, was mixed. Unemployment Claims and Existing Home Sales were positive but Philly Fed Manufacturing Index and Leading Index were both Lower so we had mixed economic news and mixed results.
Author

Nick Mastrandrea
Market Tea Leaves


