Microsoft ( NASDAQ: MSFT) established new all time highs back in April the 25th and since then it saw a 9% drop. MSFT follow the same code as the rest of the financial market so if we take a look at the technical chart of the stock we can recognize a clear impulsive pattern taking place from December 2018 low.

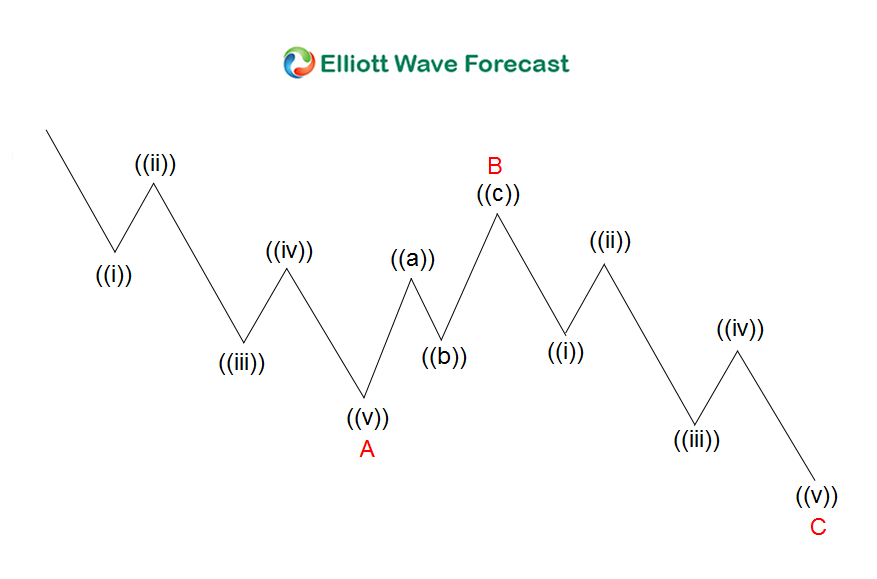
Based on the Elliott Wave Theory, every 5 waves impulsive structure is followed by a technical corrective sequences which comes in 3, 7 or 11 swings. At the end of the corrective sequence, usually the instrument will resume the move within the main trend or at least correct the previous cycle. In the Classic 3 swings ABC zigzag structure, the Market does 5 waves move, then it corrects in 3 waves followed with another 5 waves move to the same direction of the previous 5 waves.

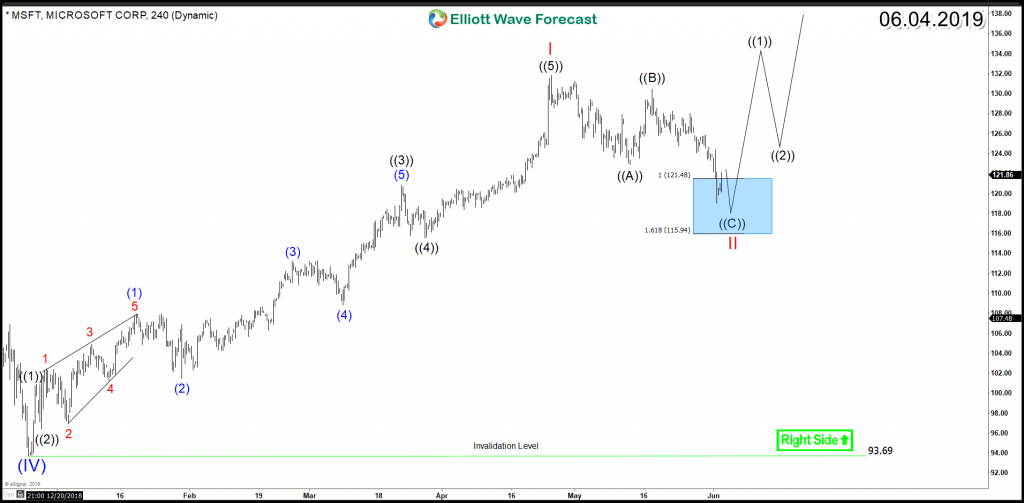
MSFT rally from $93.7 low was in impulsive 5 waves which ended at 4/25/2019 peak $131.8. Down from there it started the correction lower showing an initial 3 waves pullback which reached the 100% – $161.8% Fibonacci extension area $121.5 – $115.9 . Up from there, the stock will have the possibility to resume the rally to new all time highs and create separation to absorb the next pullback.

MSFT


MSFT 4H Chart Zigzag Structure

MSFT


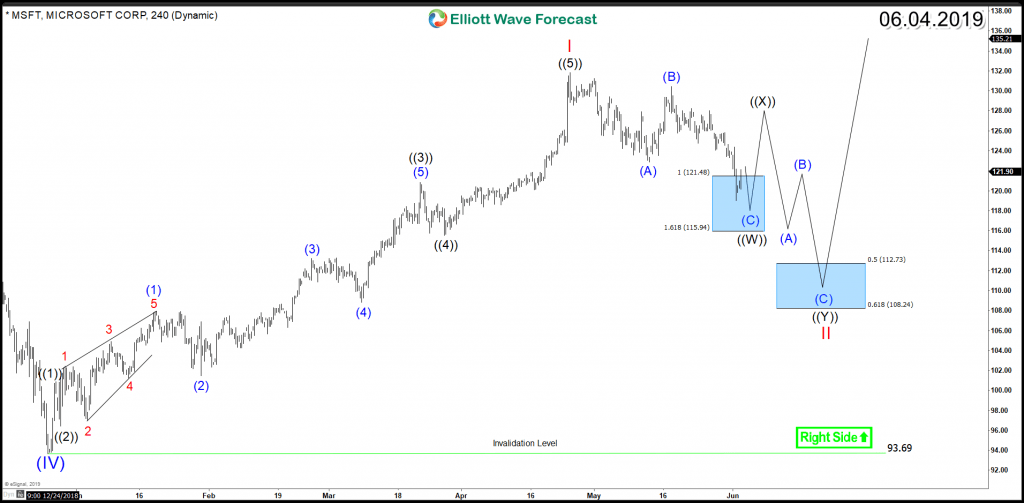
However, if MSFT only bounce in 3 waves and fail to break above April peak, then the stock will be looking to extend the correction in a 7 swings structure to the downside. In a double three structure, the Market does 3 waves move, then it corrects in 3 waves followed with another 3 waves move to the same direction of the previous 3 waves. In that case, MSFT can trade lower toward the 50% – $61.8 Fibonacci retracement area $112.7 – $108.2 before ending the ((W))((X))((Y)) structure then the stock will try one more time to rally to new all time highs.

MSFT


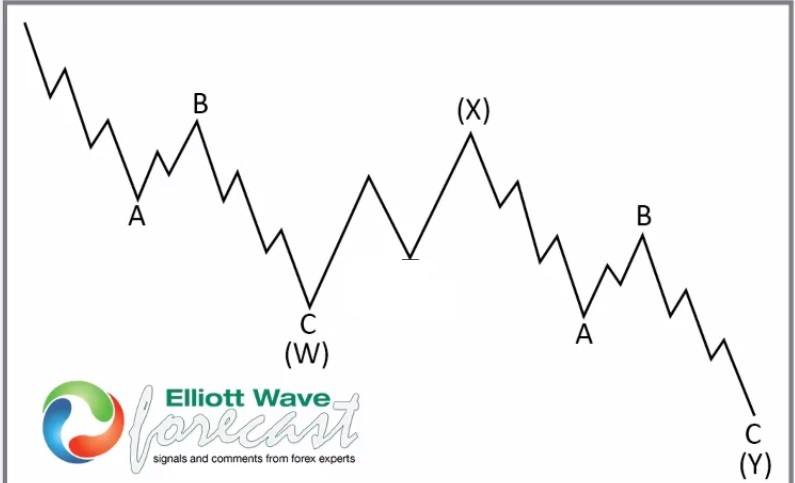
MSFT 4H Chart Double Three Structure

MSFT


Conclusion

Our Blue Box in extension creates a reaction 85% of the time and it represent a High-frequency area where the Markets are likely to end cycles and make a turn. Consequently, Microsoft ending a corrective Elliott Wave technical structure from April peak and buyers will show up around extreme area looking for the rally to resume to new all time highs or to provide a 3 waves bounce at least as long as pivot at $December 2018 low $93.7 remains intact.


Interested in active FX or CRYPTO Elliott Wave labeled charts on a daily basis? Now it's your time; we have a SPECIAL offer; 50% Off on FX and Crypto markets. Check Elliott Wave Forecast website for more details.

FURTHER DISCLOSURES AND DISCLAIMER CONCERNING RISK, RESPONSIBILITY AND LIABILITY Trading in the Foreign Exchange market is a challenging opportunity where above average returns are available for educated and experienced investors who are willing to take above average risk. However, before deciding to participate in Foreign Exchange (FX) trading, you should carefully consider your investment objectives, level of xperience and risk appetite. Do not invest or trade capital you cannot afford to lose. EME PROCESSING AND CONSULTING, LLC, THEIR REPRESENTATIVES, AND ANYONE WORKING FOR OR WITHIN WWW.ELLIOTTWAVE- FORECAST.COM is not responsible for any loss from any form of distributed advice, signal, analysis, or content. Again, we fully DISCLOSE to the Subscriber base that the Service as a whole, the individual Parties, Representatives, or owners shall not be liable to any and all Subscribers for any losses or damages as a result of any action taken by the Subscriber from any trade idea or signal posted on the website(s) distributed through any form of social-media, email, the website, and/or any other electronic, written, verbal, or future form of communication . All analysis, trading signals, trading recommendations, all charts, communicated interpretations of the wave counts, and all content from any media form produced by www.Elliottwave-forecast.com and/or the Representatives are solely the opinions and best efforts of the respective author(s). In general Forex instruments are highly leveraged, and traders can lose some or all of their initial margin funds. All content provided by www.Elliottwave-forecast.com is expressed in good faith and is intended to help Subscribers succeed in the marketplace, but it is never guaranteed. There is no “holy grail” to trading or forecasting the market and we are wrong sometimes like everyone else. Please understand and accept the risk involved when making any trading and/or investment decision. UNDERSTAND that all the content we provide is protected through copyright of EME PROCESSING AND CONSULTING, LLC. It is illegal to disseminate in any form of communication any part or all of our proprietary information without specific authorization. UNDERSTAND that you also agree to not allow persons that are not PAID SUBSCRIBERS to view any of the content not released publicly. IF YOU ARE FOUND TO BE IN VIOLATION OF THESE RESTRICTIONS you or your firm (as the Subscriber) will be charged fully with no discount for one year subscription to our Premium Plus Plan at $1,799.88 for EACH person or firm who received any of our content illegally through the respected intermediary’s (Subscriber in violation of terms) channel(s) of communication.

Recommended Content


Recommended Content

Editors’ Picks

EUR/USD regains traction, recovers above 1.0700

EUR/USD regains traction, recovers above 1.0700

EUR/USD regained its traction and turned positive on the day above 1.0700 in the American session. The US Dollar struggles to preserve its strength after the data from the US showed that the economy grew at a softer pace than expected in Q1.

EUR/USD News

GBP/USD returns to 1.2500 area in volatile session

GBP/USD returns to 1.2500 area in volatile session

GBP/USD reversed its direction and recovered to 1.2500 after falling to the 1.2450 area earlier in the day. Although markets remain risk-averse, the US Dollar struggles to find demand following the disappointing GDP data.

GBP/USD News

Gold climbs above $2,340 following earlier drop

Gold climbs above $2,340 following earlier drop

Gold fell below $2,320 in the early American session as US yields shot higher after the data showed a significant increase in the US GDP price deflator in Q1. With safe-haven flows dominating the markets, however, XAU/USD reversed its direction and rose above $2,340.

Gold News

XRP extends its decline, crypto experts comment on Ripple stablecoin and benefits for XRP Ledger

XRP extends its decline, crypto experts comment on Ripple stablecoin and benefits for XRP Ledger

Ripple extends decline to $0.52 on Thursday, wipes out weekly gains. Crypto expert asks Ripple CTO how the stablecoin will benefit the XRP Ledger and native token XRP. 

Read more

After the US close, it’s the Tokyo CPI

After the US close, it’s the Tokyo CPI

After the US close, it’s the Tokyo CPI, a reliable indicator of the national number and then the BoJ policy announcement. Tokyo CPI ex food and energy in Japan was a rise to 2.90% in March from 2.50%.

Read more

Majors

Cryptocurrencies

Signatures