Markets Move – Fractionally…

Good Morning Traders,
As of this writing 4:40 AM EST, here’s what we see:
US Dollar: Mar. USD is Up at 101.100.
Energies: April Crude is Up at 54.44.
Financials: The Mar 30 year bond is Down 6 ticks and trading at 153.01.
Indices: The March S&P 500 emini ES contract is 9 ticks Higher and trading at 2367.25.
Gold: The April gold contract is trading Down at 1255.20. Gold is 31 ticks Lower than its close.
Initial Conclusion
This is not a correlated market. The dollar is Up+ and crude is Up+ which is not normal but the 30 year bond is trading Lower. The Financials should always correlate with the US dollar such that if the dollar is lower then bonds should follow and vice-versa. The indices are Up and Crude is trading Up which is not correlated. Gold is trading Down which is correlated with the US dollar trading Up. I tend to believe that Gold has an inverse relationship with the US Dollar as when the US Dollar is down, Gold tends to rise in value and vice-versa. Think of it as a seesaw, when one is up the other should be down. I point this out to you to make you aware that when we don’t have a correlated market, it means something is wrong. As traders you need to be aware of this and proceed with your eyes wide open.
All of Asia traded lower. As of this writing all of Europe is trading higher at this hour.
Possible Challenges To Traders Today
– Core Durable Goods Orders is out at 8:30 AM EST. This is major.
– Durable Goods Orders m/m is out at 8:30 AM EST. This is major.
– Pending Home Sales m/m is out at 10 AM EST. This is major.
– FOMC Member Kaplan Speaks at 11 AM EST. This is major.
Treasuries
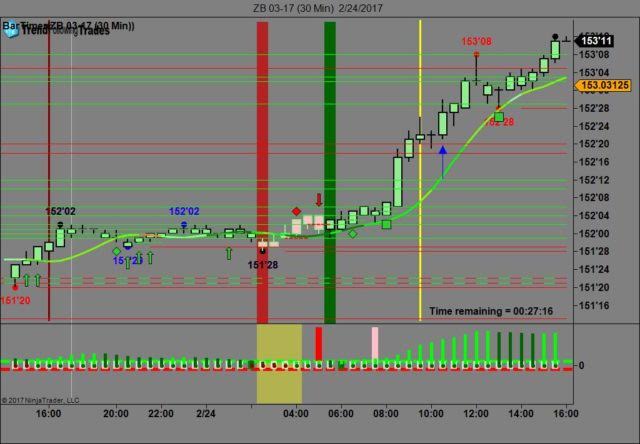
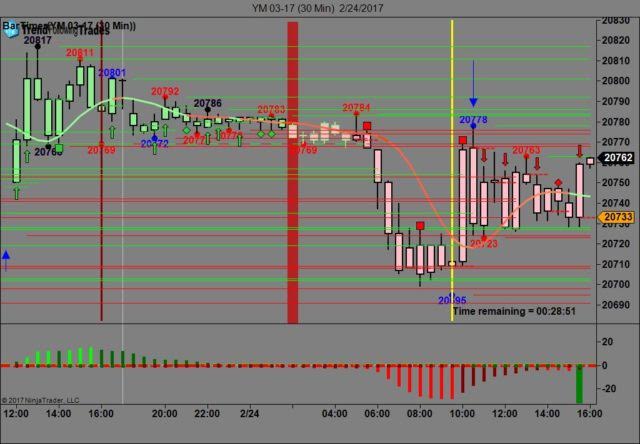
We’ve elected to switch gears a bit and show correlation between the 30 year bond (ZB) and The YM futures contract. The YM contract is the DJIA and the purpose is to show reverse correlation between the two instruments. Remember it’s liken to a seesaw, when up goes up the other should go down and vice versa.
On Friday the ZB made it’s move at around 10:30 AM EST with no news to speak of. The ZB hit a higher high at around that time and the YM hit a high. If you look at the charts below ZB gave a signal at around 10:30 AM and the YM was moving lower at the same time. Look at the charts below and you’ll see a pattern for both assets. ZB hit a higher high at around 10:30 AM EST and the YM hit a high. These charts represent the newest version of Trend Following Trades and I’ve changed the timeframe to a 30 minute chart to display better. This represented a long opportunity on the 30 year bond, as a trader you could have netted about 20 plus ticks per contract on this trade. Each tick is worth $31.25. We added a Donchian Channel to the charts to show the signals more clearly.
Charts Courtesy of Trend Following Trades built on a NinjaTrader platform.
Bias
On Friday we gave the markets a downside bias as the Bonds and Gold were both trading higher and this usually results in a downside day. The Dow gained 11 points and the other indices gained albeit fractionally. Today we aren’t dealing with a correlated market however our bias is to the upside.
Could this change? Of Course. Remember anything can happen in a volatile market.
Commentary
On Friday we gave the markets a downside bias as both the Bonds and Gold were trading higher Friday morning and ordinarily this results in a downside day. Ironically the markets opened lower and stayed lower even after President Trump made an announcement regarding tax reductions for the middle class. On would think that this was enough to drive the markets higher but at that point, it didn’t happen. However at about 10 minutes prior to the market close the markets rose and the Dow closed higher by 11 points, the S&P by about 4 and the Nasdaq by about 10. Last week we mentioned in one of our editions that the Smart Money (institutionals) are adamant about the market rising and Friday’s session was certainly proof of that. From our point of view we’ll stick with our rules of market correlation as most of Friday’s session was down.
Author

Nick Mastrandrea
Market Tea Leaves


