Market Update: S&P 500 into resistance
S&P 500 hour
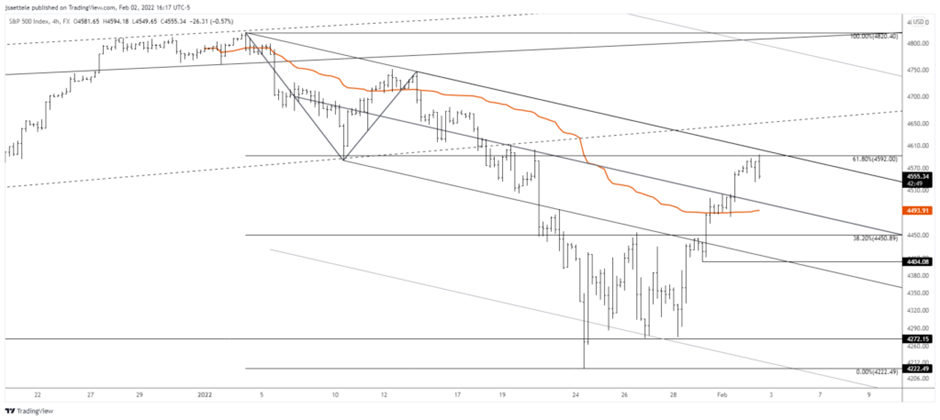
SPX has retraced 61.8% of the decline from the high. This is also ‘original’ trendline resistance. This is a perfect spot for at least an interim high. I’m looking lower towards 4494 or so (2022 VWAP) and possibly 4404.
1/31 – January produced some monthly reversals of note. SPY made a 1 bar monthly volume reversal. Notice that reversals also occurred in June/July 2007 (high) and October 2002 (low). There were failed signals however in 1997. Obviously, monthly signals may not be all that timely. These are ‘big picture’ observations. It’s important to understand in light of weekly bullish reversals in indices last week! These charts are shown below the monthly charts in this post.
DJI hourly
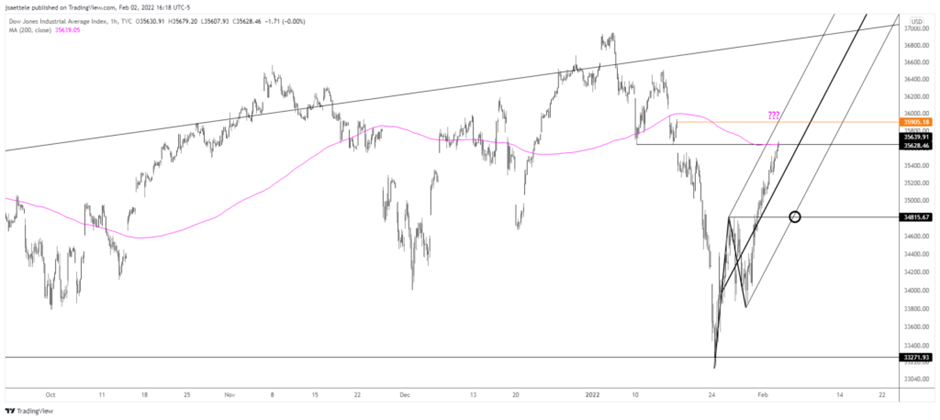
The Dow pushed above 35500 but has reached the 1/10 low and 200 hour average. The level isn’t as ‘clean’ for resistance as the SPX level but this level ‘makes sense’ for resistance. Another level to be aware of is the uncovered close (gap) at 35905. If price does fade here then 34815 is eventual proposed support.
1/31 – DIA made a 1 bar monthly reversal in January. Signals also occurred in October 2018 (high), July 2007 (high), and October 2002 (low). While all of these eventually ‘worked’, they didn’t work immediately. Near term, pay attention to 35500 for resistance. This 2 legs up from the low and the 61.8% retrace of the decline.
Spot gold 4 hour
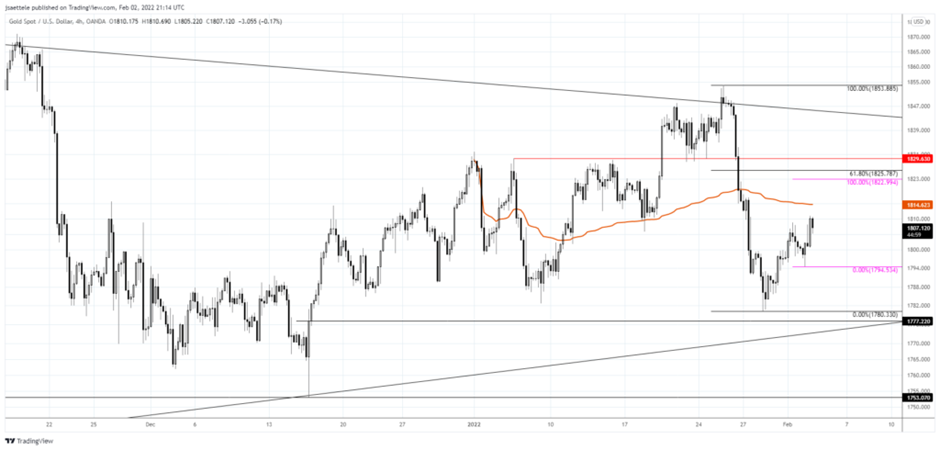
Gold is clawing back after getting destroyed last week. 1822/30 sticks out as resistance. The bottom of the zone is defined by 2 equal legs up from the low. The top of the zone is defined by a clear horizontal. The 61.8% retrace is in the middle of the zone at 1826.
US Dollar 4 hour
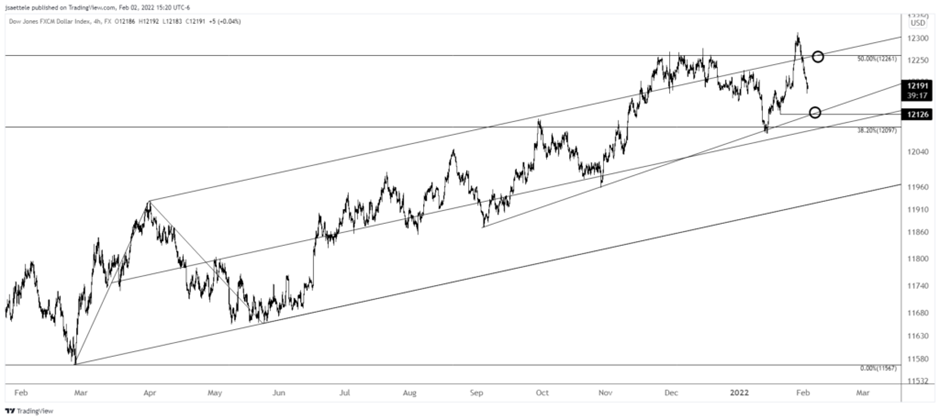
USDOLLAR has nearly retraced all of last week’s advance, which feels like a bull trap. The breakdown doesn’t begin in earnest until under 12100 but levels to know on a near term basis are 12126 for a bounce and 12260s for resistance and a lower high.
EUR/USD 4 hour
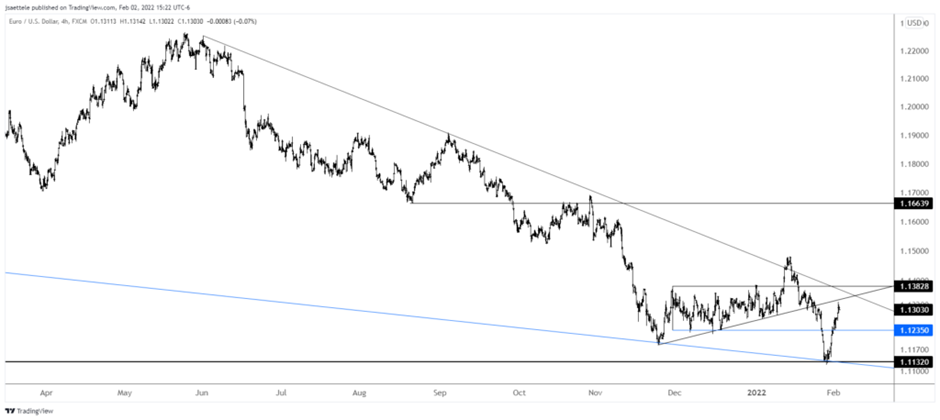
EURUSD has reached the noted 1.1310 and is due for a pause. Support at this point is probably 1.1230s (month open is 1.1235). A breakout occurs above 1.1380 (trendline and former resistance). ECB is tomorrow.
2/1 – EURUSD is unfolding in a clear impulsive manner. A small 5th wave may be underway now towards 1.1310 or so. Eventually, the top side of the trendline that originates at the January high (blue line) will be in line for support…maybe near 1.1200.
USD/JPY hourly
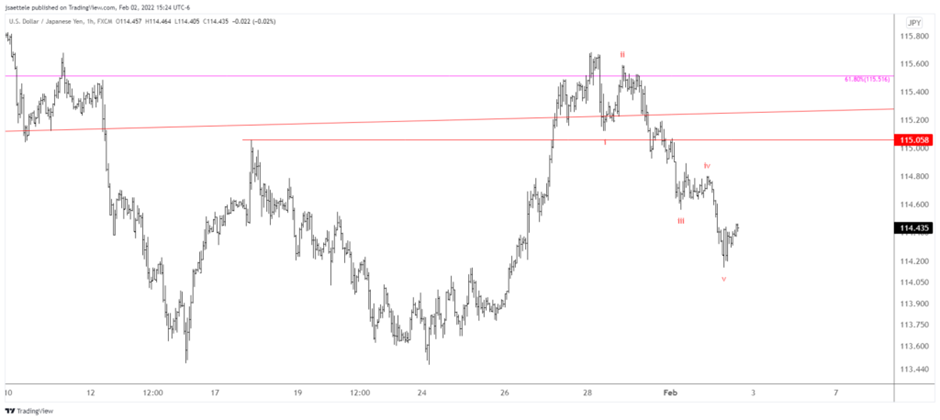
The USDJPY decline from last week’s high is in 5 waves so respect bounce potential into 115.05 or so before another leg lower.
GBP/USD 4 hour
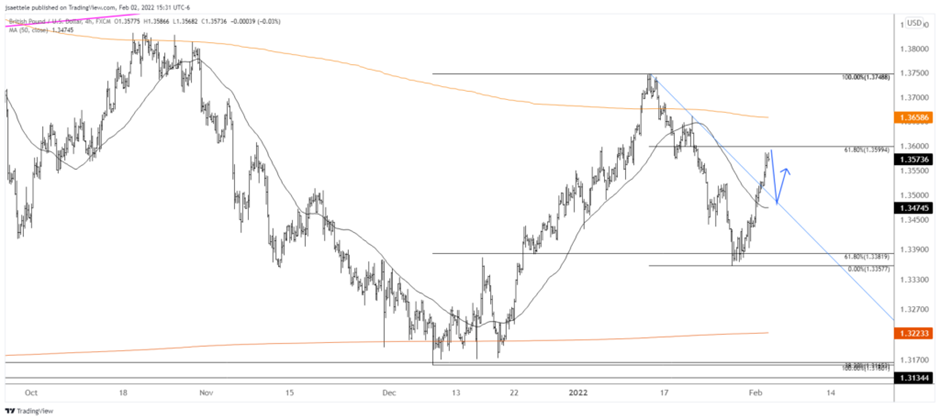
GBPUSD is nearing the 61.8% retrace of the decline from the January high at 1.3600 so respect potential for a pullback. I’m ‘thinking’ that the top side of the short term former resistance line (blue line) is in line for support near 1.3480/90 on BoE tomorrow.
2/1 – 1.3375 held beautifully for GBPUSD. Price is testing short term trendline resistance now so respect pullback potential with support at 1.3430/40. Bigger picture, I’ll note that the daily RSI profile is bullish (see below). This means that the recent pivot high price occurred with RSI above 70 and the most recent pivot low occurred with RSI above 30 (near 40).
NZD/USD 4 hour
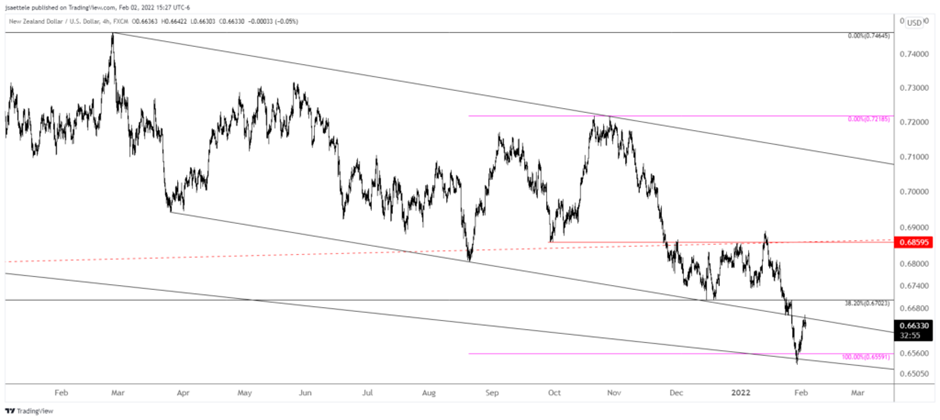
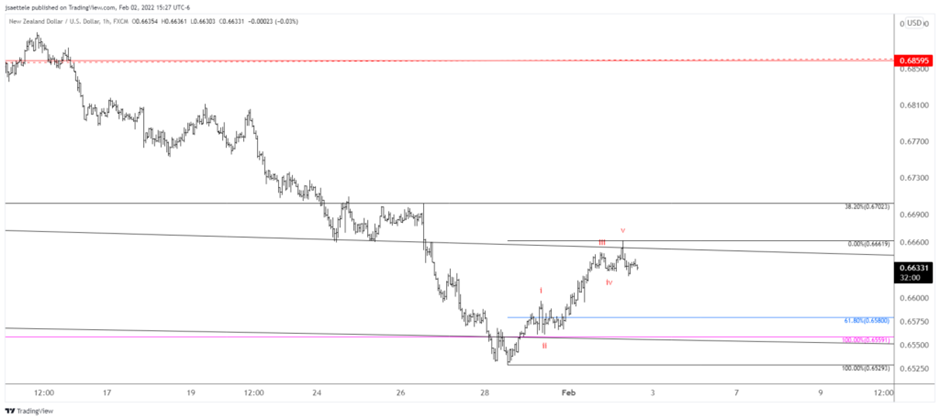
NZDUSD has traded into the underside of former channel support. Like the other USD crosses, a pullback here makes sense. That said, the rally is a clear impulse (see below) so focus is on identifying a higher low. Proposed support is .6580/90.
2/1 – Kiwi has ripped higher from the top side of the line that extends off of the 2017 and 2018 highs. Also, the drop from the 2021 high consists of 2 equal waves. From an Elliott perspective, the decline consists of 2 legs and each leg is in 3 waves. This is a complex correction sometimes known as a ‘double 3’. Watch for support near .6590.
NZD/USD hourly
Author

Scandinavian Markets Research Team
Scandinavian Capital Markets
Scandinavian Capital Markets' Research Team boasts world-renowned, professional market analysts and traders with proven track records in the markets and as business leaders.


