Market turning points

Current Position of the Market
SPX: Long-term trend – Having rallied well past a .618 retracement of the decline into March 2020, it is time to consider the possibility that the retracement was only an interruption of the bull market which originated in 2009.
Intermediate trend – Down into mid-July
Analysis of the short-term trend is done daily with the help of hourly charts. It is an important adjunct to the analysis of daily and weekly charts which discusses the course of longer market trends.
Short-term Peaking
Important Cycle lows
Market Analysis (Charts courtesy of QChart)
SPX-TRAN weekly charts
The indexes made a recovery high a month ago and have been trading in a range, since. With the 40-wk cycle low looming ahead, it is likely that this consolidation will soon come to an end and the decline from 6/7 will be able to continue into the middle of July. I have posted the normal Fibonacci retracement levels as potential guides for the coming decline. A mild retracement would take SPX down to ~2830, while a more severe one down to ~ 2700. TRAN has already retraced down to its .382 level of 8685 and is therefore more likely than SPX to retrace 50% (8255).

SPX daily chart
In the last letter, I had expected a little more weakness from the 36-td cycle which could have continued the correction from 3233, but traders focused on bullish economic statistics and rallied the index to form an a-b-c consolidation pattern which is probably not quite complete. After a low early next week, we should finish the c-wave of the pattern before the 40-wk cycle takes over with a vengeance. Even a .382 retracement of the first wave to 3233 would net a ~300-point decline from the next short-term high which could come toward the end of the week.
After this correction, influenced by a super bullish NDX, SPX will have a good chance of making a new high, perhaps even an all-time high before the next correction. The cycles will certainly favor this but, unless congress appropriates more relief funds, the economic reports should soon again reflect the true state of the economy, and this could dampen the effect of the bullish cyclicality.
For now, the daily indicators reflect a bullish trend since the last short-term low at 3000, so we can expect a few more days of near-term bullishness after Monday or Tuesday.

SPX hourly chart
Friday morning’s bullish jobs report caused a strong opening gap which pushed to 3165 in the opening minutes before serious profit-taking caused a partial retracement of the gap. The index then tried to hold the steep trend line from 3000 before giving way in the last two hours of trading, which resulted in closing the gap almost entirely. It will undoubtedly be left up to Monday morning to finish the job with a potential retracement to about 3100-3110.
After some negative divergence continued to form in all three oscillators as price retraced its initial selling wave of the morning, they turned down and accelerated into the close finishing the day with an incomplete retraction pattern which will be left to Monday to complete.

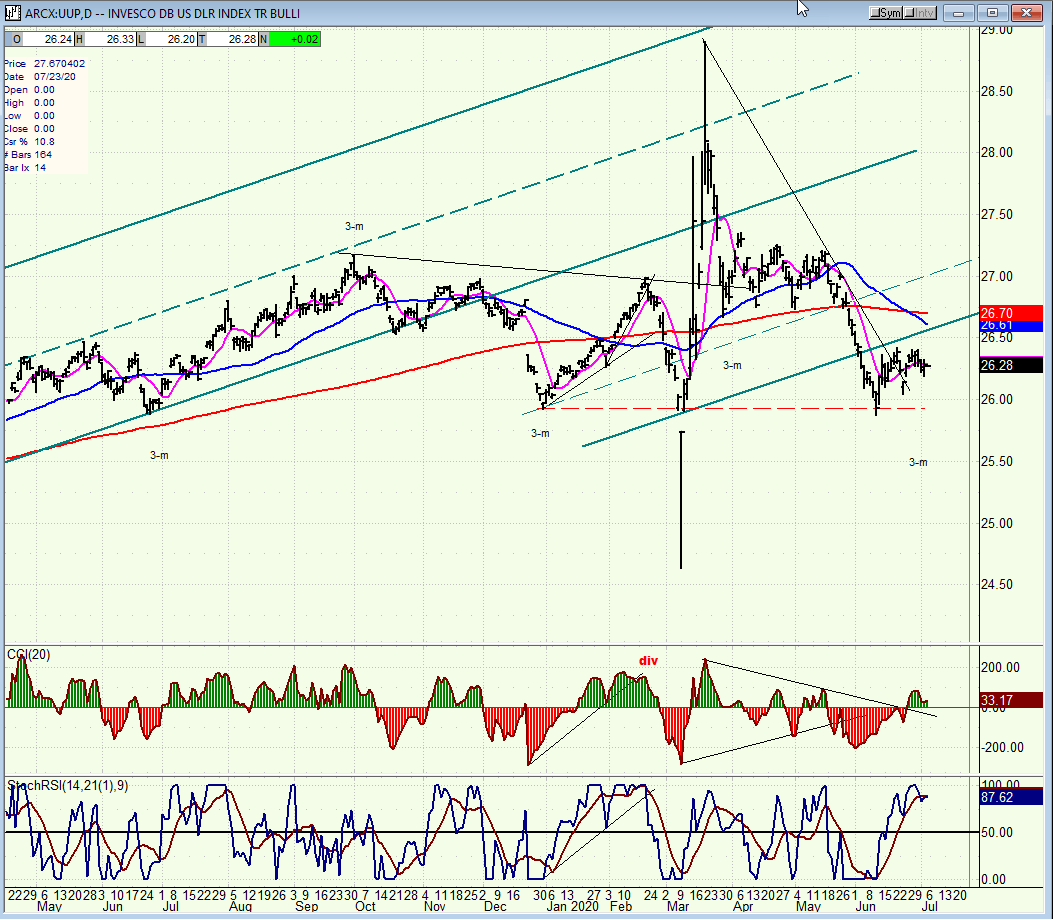
UUP (dollar ETF) daily
UUP looks as if it needs one more pull-back to complete its correction. The dollar could drop a couple more points on this move.
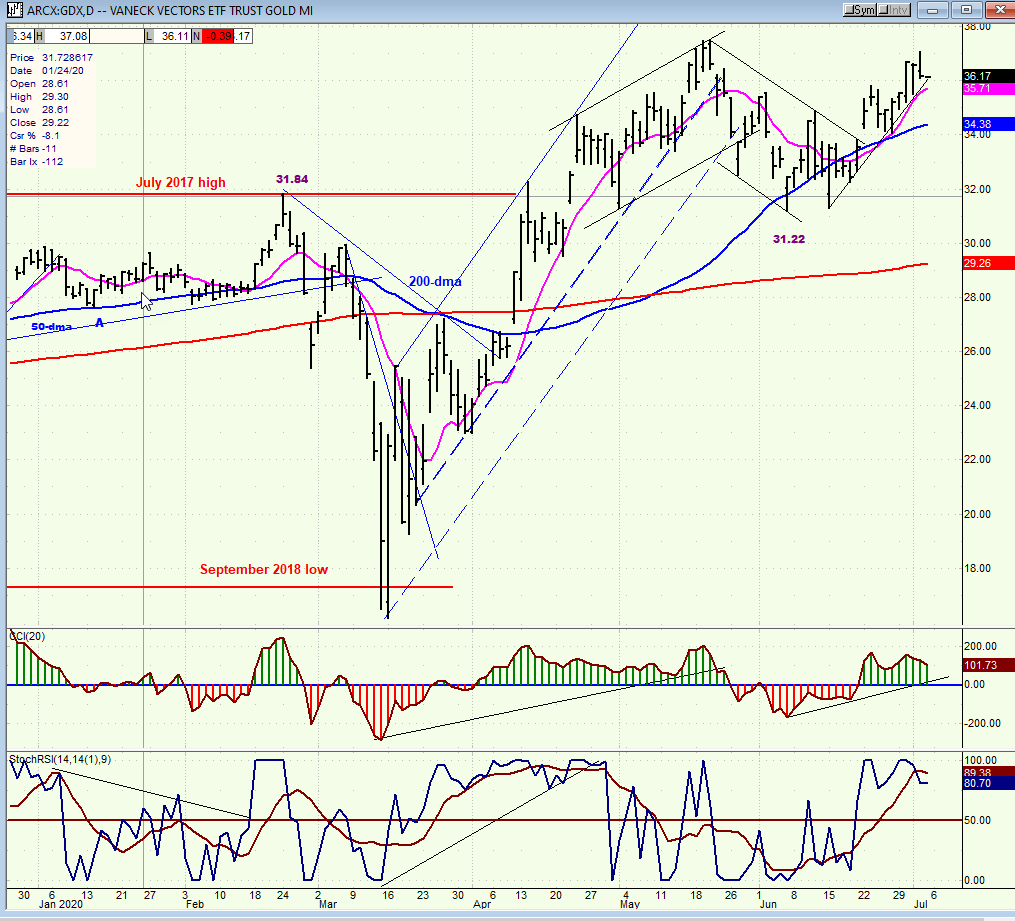
GDX (Gold miners ETF) daily
GDX may be preparing for a sizeable move on the upside after it has completed another minor pull-back. If this is correct, then GDX is heading for 43 before the next consolidation. I am not an expert on EWT, but it could be ready for 3 of 3! The next two weeks should prove or disprove this premise.
PAAS (Pan American Silver Corp.) daily
PAAS may already be slightly ahead of GDX, but observing the same format. The P&F chart is not as clear, but the next move should lead to a move past its former high of 37 -- perhaps to 46 (potentially)!

BNO (U.S. Brent oil fund) daily
BNO should increase its base with the pull-back into the 40-wk cycle low. This will give us a better idea of what the next move can bring.

Summary
The 36-37-td cycle, which is due early next week was countered by strong economic reports which took away most of its punch. Its next up-phase should also be limited by the declining 40-wk cycle which is due to bottom near 7/20.
Author

Andre Gratian
Market Turning Points
When I was a stock broker years ago, a friend introduced me to technical analysis of the market and it is not an exaggeration to say that I fell in love with this approach! Ever since then, it has become an increasingly important


