Managing Risk/Investment in a Non-Linear World

Is there an average return on my investment on which I can count? The answer is no because change is the only constant in the financial world. A non-linear, changing relationship is a better model for managing risk.
Expectations of Mean Reversion: Getting Back to Normal
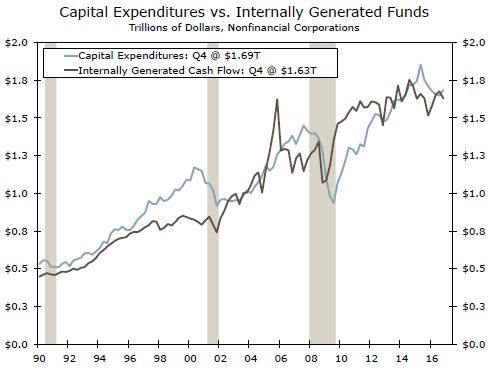
A standard approach for investors/analysts sets expectations of getting back to normal and finding "an average" return on an investment over time. In other words, there is an average return on investments, and deviations from the average are only temporary. Our statistical analysis paints a different picture: there is often no normal level (average). Our analysis suggests that both capital expenditures and internally generated cash flow are not mean-reverting, top chart. We found structural breaks in both series. A structural break in a series indicates that there is no normal level (no average return) because different periods (sub-samples) have statistically different means and/or deviations from those averages. Basically, expectations of getting back to normal are misleading and using models is a way to test whether underlying series are mean reverting.
Debt Finance
How do corporations finance their debt? To what extent do they utilize corporate bonds relative to credit market instruments (middle chart)? Is there an average level of corporate debt? The answer is no once again. Our analysis suggests there is no average level, and we found structural breaks in nonfinancial debt, corporate bonds and commercial paper at nonfinancial corporations.
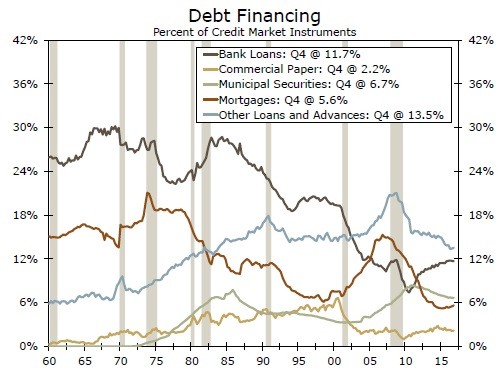
Another common assumption is that there is a linear relationship between two series, i.e., corporations finance debt employing a fixed share of corporate bonds relative to commercial paper, on average. However, we found that both corporate bonds and commercial paper are non-linear and that implies the rate of growth in both series is not constant. Put differently, there are no "fixed" preferences when utilizing corporate bonds or commercial paper for debt finance. In sum, we strongly suggest to make sure (by using statistical tests) whether underlying series exhibit linear or non-linear behavior, instead of assuming a linear trend.
Do Rising Rates Cause Recessions?
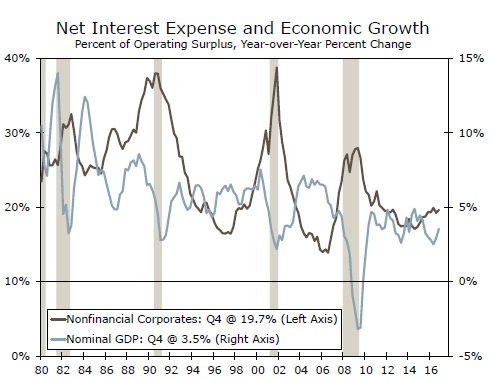
In this rising interest rates environment, some investors worry about a potential recession in the near future. A rise in interest rates could drive an increase in interest expenses and may squeeze businesses and consumers and thereby growth. Our Granger causality test results suggest net interest expense does not drive growth (bottom chart). The FOMC typically raises interest rates during expansions (positive growth rates) and thereby growth drives interest rates. Economies do fall into recessions and a rising rate environment may or may not lead to recessions. Some sort of shock, other than rising interest rates, may cause recessions through a channel other than corporate debt. We do not expect a recession in the near term with our recession probability model.
Author

Wells Fargo Research Team
Wells Fargo


