Major change in trend US stocks, T-bonds, US dollar, and oil

The March major planetary events can be sorted into two segments.
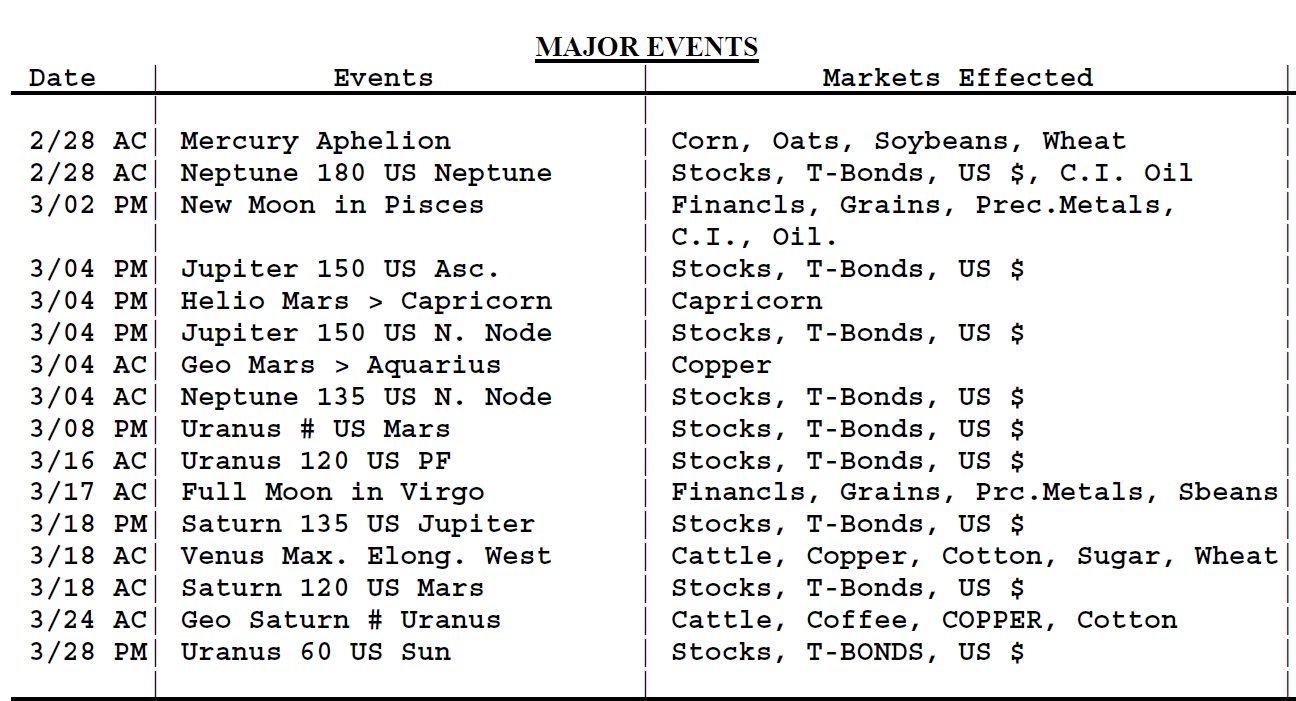
1. A. 2/28 AC – Mercury Aphelion. Major change in trend Corn, Oats, Soybeans, Wheat.
B. 2/28 AC – Neptune 180 US Neptune. Major change in trend US Stocks, T-Bonds, US Dollar, & Oil.
C. 3/02 PM – New Moon in Pisces. Major change in trend Financials, Grains, Precious Metals and OIL.
D. 3/04 PM – Jupiter 150 US Saturn. Moderate change in trend US Stocks, T-Bonds, US Dollar.
E. 3/04 PM – Helio Mars enters Capricorn. Important change in trend Coffee.
F. 3/04 AC – Geo Mars enters Aquarius. Important change in trend Copper.
G. 3/04 AC – Neptune 135 US North Node. Moderate change in trend US Stocks, T-Bonds, US Dollar.
H. 3/08 PM – Uranus Contra-Parallel Latitude US Mars. Major change in trend US Stocks, T-Bonds, US Dollar.
2. A. 3/16 AC – Uranus 120 US PF. Major change in trend US Stocks, T-Bonds, US Dollar.
B. 3/17 AC – Full Moon in Virgo. Major change in trend Financials, Grains, Precious Metals & especially Soybeans.
C. 3/18 PM – Saturn 135 US Jupiter. Moderate change in trend US Stocks, T-Bonds, US Dollar.
D. 3/18 AC – Venus Maximum Elongation West. Major change in trend Cattle, Copper, Cotton, Sugar & Wheat.
E. 3/18 AC – Saturn 120 US Mars. Major change in trend US Stocks, T-Bonds, US Dollar.
F. 3/24 AC – Geo Saturn Contra-Parallel Uranus. Major change in trend Cattle, Coffee, COPPER, & Cotton.
G. 3/28 PM – Uranus 60 US Sun. Moderate change in trend US Stocks, T-Bonds, US Dollar.
March 2022 market monitor list
The March planetary analysis indicates that the best areas to monitor this month are: 1) Stocks; 2) US $; 3) T-Bonds; 4) Oil; 5) Copper; 6) Wheat; 7 tie) Cattle & Cotton: 8) Oats; 9) DJIA*; 10) Soybeans; 11) C.I./CRB: 12 tie) Corn & Sugar; 13) S&P*; 14) UK; 15) Gold & OJ; 16) J-Yen: 17) Coffee; 18) Silver; and 19) OPEC.
2022 January barometer and Super Bowl indicator
Update - Two historically accurate forecasting Stock Market models are the January Barometer and the Super Bowl Stock Market Indicator.
2022 January Barometer Update – January, the S&P closed sharply lower, indicating that the market would close lower for 2022. This also indicated that in the Super Bowl, the AFC Team, the Cincinnati Bengals should win the Super Bowl.
2022 Super Bowl Indicator Update - This year, the Super Bowl was played on Sunday, February 13, between the NFC champion Los Angeles Rams and the AFC champion Cincinnati Bengals (year of the Tiger). The old Wall Street adage that as January goes, so goes the year, not only applies to the Stock Market, but also to the Super Bowl. Given the very positive track record of both models, there should be a high correlation between these two indicators. Unfortunately, that is not what happened this time, as the NFC Los Angeles Ram came from behind in the closing minutes to win. Therefore, the Super Bowl indicator is indicating that the Stock Market will close higher for 2022.
2022 –Synthesis Forecast – Considering both of these models, which seem to be in conflict to each other, and considering how the Super Bowl game and the January Barometer transpired, I think we should have a mixed year. The biggest down period should be during the middle two quarters and then there should be a rally in the 4th quarter for a marginally higher year.
Author

Norm Winski
Independent Analyst
www.astro-trend.com


