Kospi Cycles Longer Term Swing Count Remains Bullish

The KOSPI Index in the long term has been trending higher with other world indices since inception in 1983. The index began with a base value set at 100 and trended higher until it ended that cycle in 1994. The index then corrected that cycle with the dip into 1998 lows during the Asian Financial Crisis. That is where the monthly chart pictured below begins. From the 1998 lows the index did three bullish swings higher into the November 2007 highs. The pullback from there until October 2008 was strong enough to suggest it was correcting the whole cycle up from the June 1998 lows.

Secondly I would like to mention this is a swing count. It is not an Elliott Wave count. As per the rules an impulse travels in the direction of the trend in 5-9 or 13 swings. When the bullish trend renewed to the April 2011 highs it reached the .618-.764 Fibonacci extension of the June 1998 to November 2007 cycle. This is a usual area for a 5th swing of a cycle. The 6th swing dip to the September 2011 lows corrected that cycle up from the October 2008 lows. The analysis continues below the chart.


Kospi Monthly Chart

Kospi

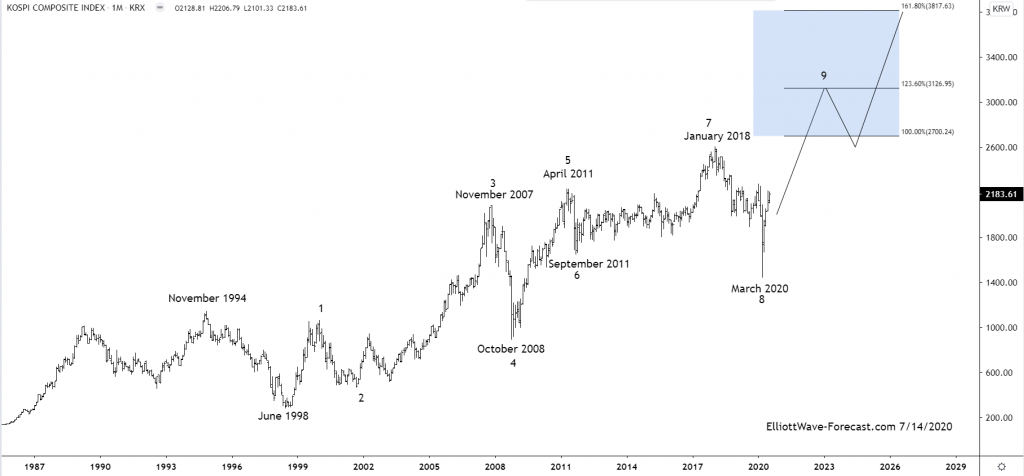
Thirdly, how these extension areas are measured. Take the Fibonacci extension tool on a charting platform. On this chart, point 1 will be at the beginning of the cycle at the 1998 lows. From there on up to the 2007 highs, marked with a 3, will be point 2. The point 3 will be down at the 2008 lows. This point is marked with a 4. The extension areas shown are the same as long as price remains above the 2008 lows. As previously mentioned from the 2008 lows the index has bounced in a 5th swing higher as well as correcting that bounce with the 2011 lows.

Lastly in conclusion the bounce from the 2011 lows ended a cycle on January 2018 and the dip to the March 2020 lows corrected that cycle. It should in the near term remain above there. Until it gets back above the January 2018 highs another swing lower can not be ruled out. However the trend is up and the index should trade higher into the target area at 2700-3126+ area before it sees another larger pullback to correct the cycle up from the March 2020 lows.

FURTHER DISCLOSURES AND DISCLAIMER CONCERNING RISK, RESPONSIBILITY AND LIABILITY Trading in the Foreign Exchange market is a challenging opportunity where above average returns are available for educated and experienced investors who are willing to take above average risk. However, before deciding to participate in Foreign Exchange (FX) trading, you should carefully consider your investment objectives, level of xperience and risk appetite. Do not invest or trade capital you cannot afford to lose. EME PROCESSING AND CONSULTING, LLC, THEIR REPRESENTATIVES, AND ANYONE WORKING FOR OR WITHIN WWW.ELLIOTTWAVE- FORECAST.COM is not responsible for any loss from any form of distributed advice, signal, analysis, or content. Again, we fully DISCLOSE to the Subscriber base that the Service as a whole, the individual Parties, Representatives, or owners shall not be liable to any and all Subscribers for any losses or damages as a result of any action taken by the Subscriber from any trade idea or signal posted on the website(s) distributed through any form of social-media, email, the website, and/or any other electronic, written, verbal, or future form of communication . All analysis, trading signals, trading recommendations, all charts, communicated interpretations of the wave counts, and all content from any media form produced by www.Elliottwave-forecast.com and/or the Representatives are solely the opinions and best efforts of the respective author(s). In general Forex instruments are highly leveraged, and traders can lose some or all of their initial margin funds. All content provided by www.Elliottwave-forecast.com is expressed in good faith and is intended to help Subscribers succeed in the marketplace, but it is never guaranteed. There is no “holy grail” to trading or forecasting the market and we are wrong sometimes like everyone else. Please understand and accept the risk involved when making any trading and/or investment decision. UNDERSTAND that all the content we provide is protected through copyright of EME PROCESSING AND CONSULTING, LLC. It is illegal to disseminate in any form of communication any part or all of our proprietary information without specific authorization. UNDERSTAND that you also agree to not allow persons that are not PAID SUBSCRIBERS to view any of the content not released publicly. IF YOU ARE FOUND TO BE IN VIOLATION OF THESE RESTRICTIONS you or your firm (as the Subscriber) will be charged fully with no discount for one year subscription to our Premium Plus Plan at $1,799.88 for EACH person or firm who received any of our content illegally through the respected intermediary’s (Subscriber in violation of terms) channel(s) of communication.

Recommended Content


Recommended Content

Editors’ Picks

EUR/USD edges lower toward 1.0700 post-US PCE

EUR/USD edges lower toward 1.0700 post-US PCE

EUR/USD stays under modest bearish pressure but manages to hold above 1.0700 in the American session on Friday. The US Dollar (USD) gathers strength against its rivals after the stronger-than-forecast PCE inflation data, not allowing the pair to gain traction.

EUR/USD News

GBP/USD retreats to 1.2500 on renewed USD strength

GBP/USD retreats to 1.2500 on renewed USD strength

GBP/USD lost its traction and turned negative on the day near 1.2500. Following the stronger-than-expected PCE inflation readings from the US, the USD stays resilient and makes it difficult for the pair to gather recovery momentum.

GBP/USD News

Gold struggles to hold above $2,350 following US inflation

Gold struggles to hold above $2,350 following US inflation

Gold turned south and declined toward $2,340, erasing a large portion of its daily gains, as the USD benefited from PCE inflation data. The benchmark 10-year US yield, however, stays in negative territory and helps XAU/USD limit its losses. 

Gold News

Bitcoin Weekly Forecast: BTC’s next breakout could propel it to $80,000 Premium

Bitcoin Weekly Forecast: BTC’s next breakout could propel it to $80,000

Bitcoin’s recent price consolidation could be nearing its end as technical indicators and on-chain metrics suggest a potential upward breakout. However, this move would not be straightforward and could punish impatient investors. 

Read more

Week ahead – Hawkish risk as Fed and NFP on tap, Eurozone data eyed too

Week ahead – Hawkish risk as Fed and NFP on tap, Eurozone data eyed too

Fed meets on Wednesday as US inflation stays elevated. Will Friday’s jobs report bring relief or more angst for the markets? Eurozone flash GDP and CPI numbers in focus for the Euro.

Read more

Majors

Cryptocurrencies

Signatures