Key trading levels: AUD/JPY, AUD/USD, EUR/JPY, EUR/USD, GBP/JPY, and GBP/USD [Video]
![Key trading levels: AUD/JPY, AUD/USD, EUR/JPY, EUR/USD, GBP/JPY, and GBP/USD [Video]](https://editorial.fxstreet.com/images/Markets/Currencies/international-currencies-coins-and-banknotes-72156399_XtraLarge.jpg)
Overview
Duncan Cooper summarises the key trading levels of AUDJPY, AUDUSD, EURJPY, EURUSD, GBPJPY, and GBPUSD for the week ahead.
Last week AUDJPY, AUDUSD, EURUSD, GBPJPY, and GBPUSD finished down for the week. EURJPY managed to just finish positive for the week. A highly volatile week with the US raising interest rates by 0.75%.
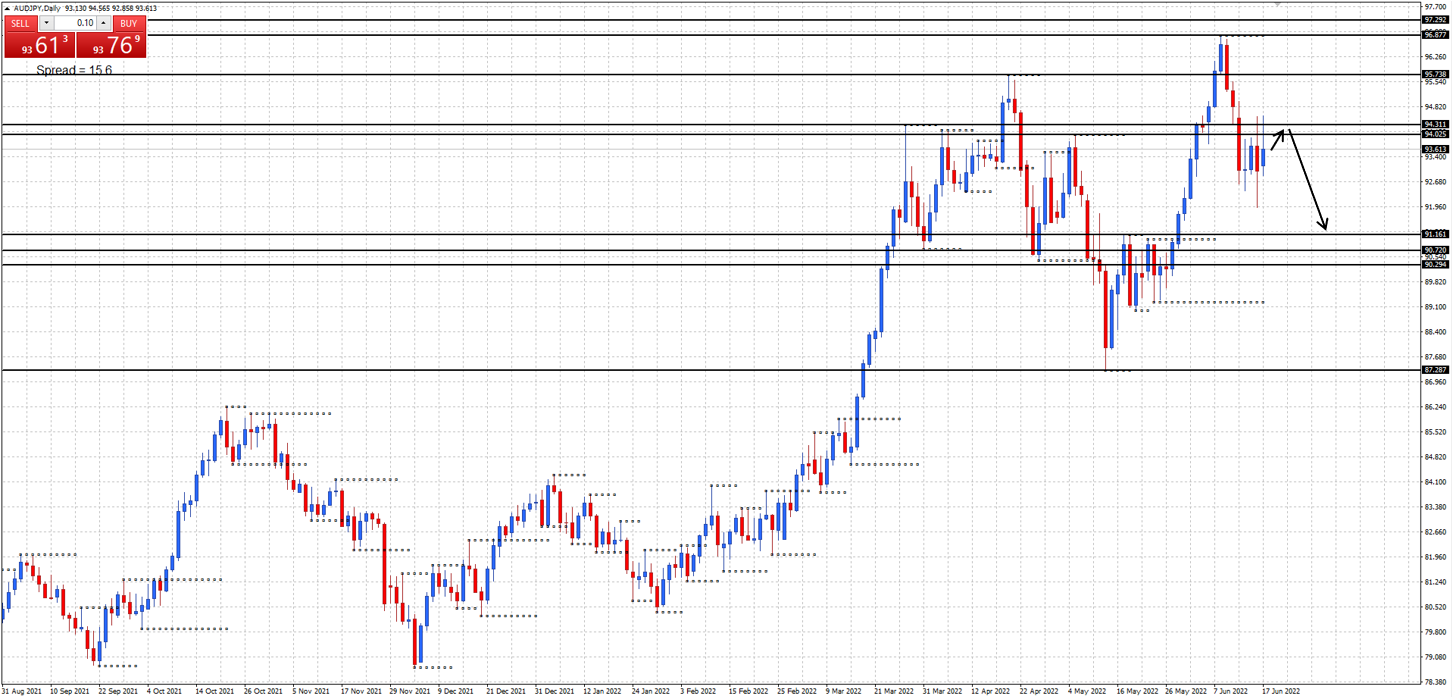
AUD/JPY daily chart
Monthly support at 90.72 and 90.29, resistance at 97.29.
Weekly support at 87.28, resistance at 94.31 and 95.73.
Daily support at 91.16, resistance at 94.02 and 96.87.
Price held at the 94.31 weekly resistance level last week. Will price hold at the 94.31 weekly resistance level and move down to test the 91.16 daily support level this week?
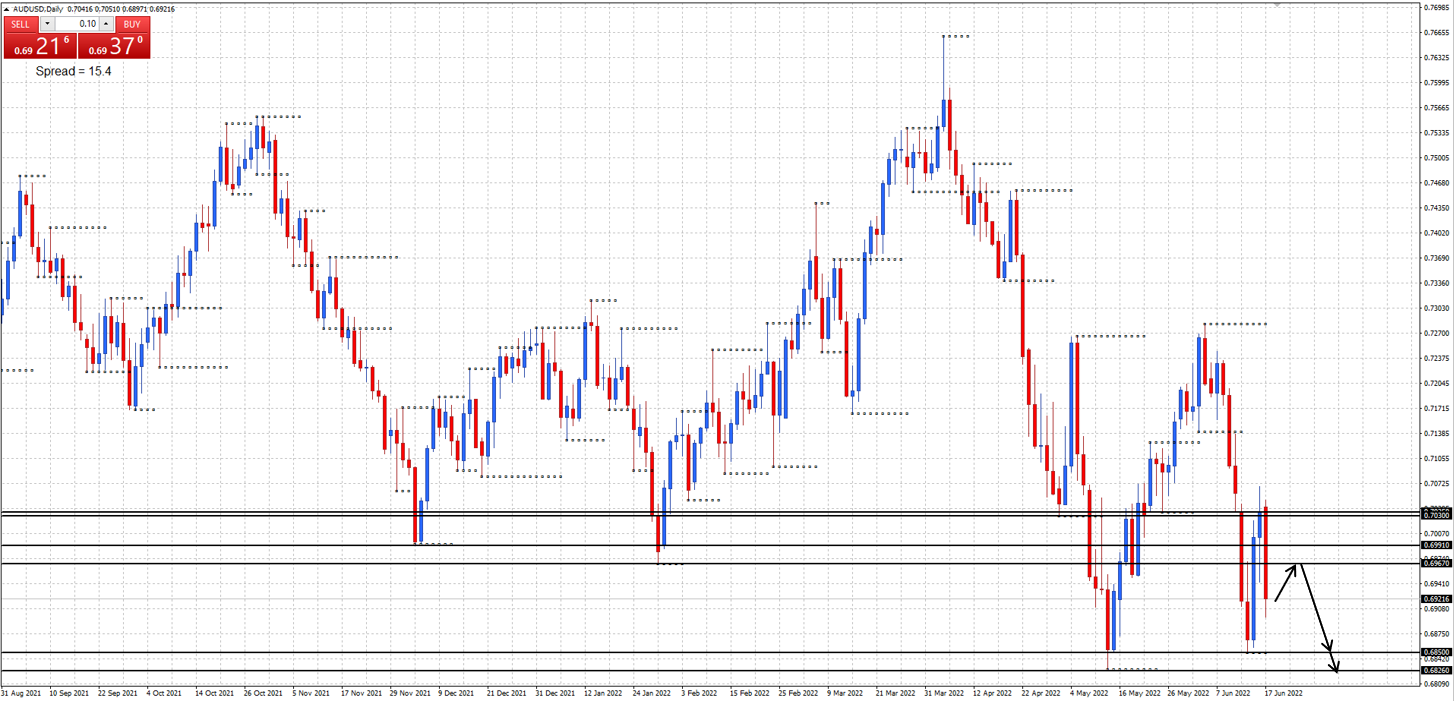
AUD/USD daily chart
Monthly support at 0.6826, resistance at 0.6967 and 0.6991.
Weekly support at 0.6828, resistance at 0.6967.
Daily support at 0.6850, resistance at 0.7030 and 0.7035.
Price declined down from the 0.7030-35 daily resistance levels last week. Will price continue to decline and retest the 0.6826 monthly support level this week?
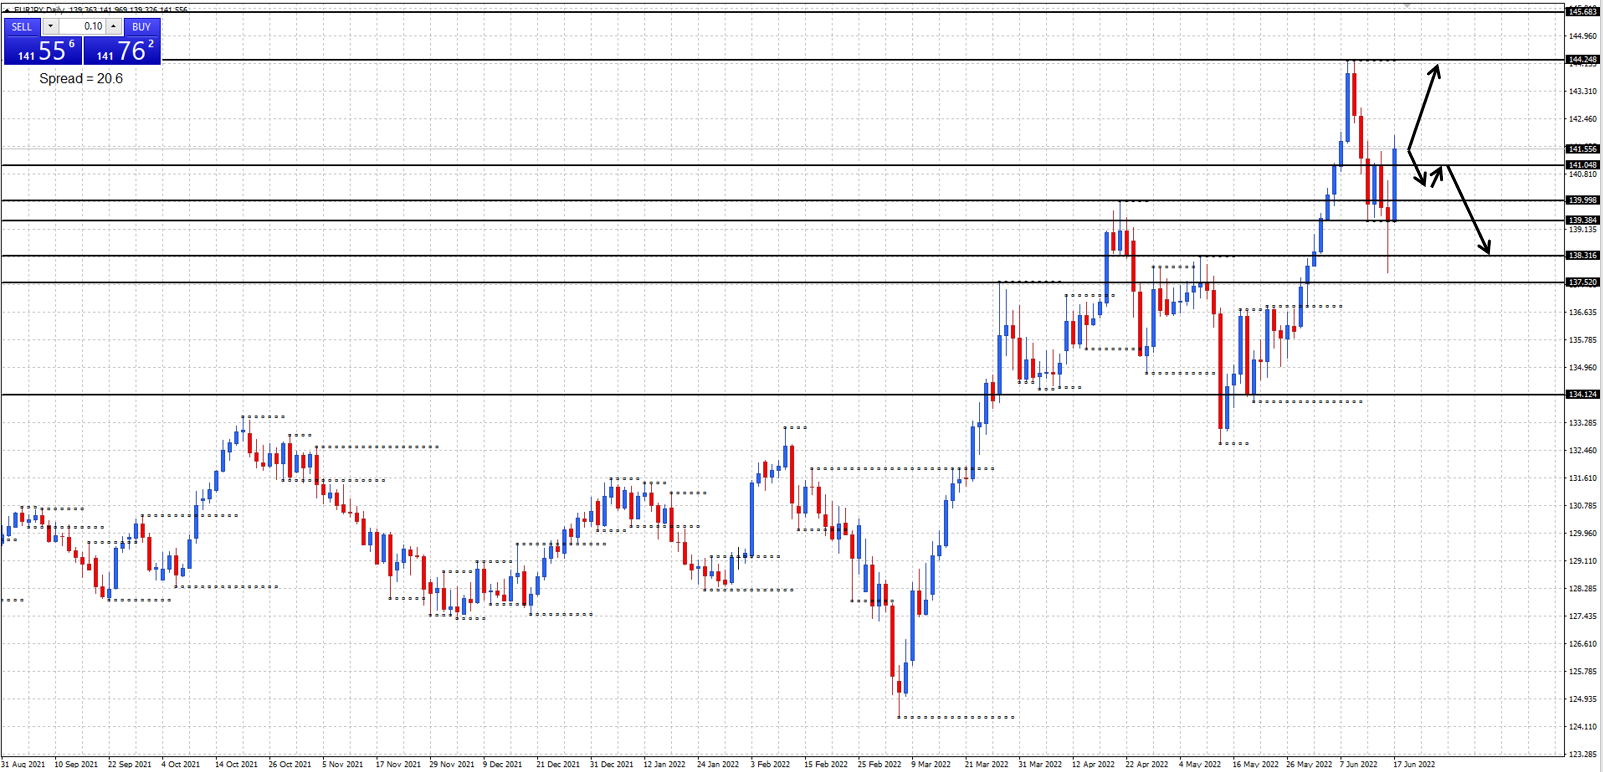
EUR/JPY daily chart
Monthly support at 141.04 and 134.12, resistance at 145.68.
Weekly support at 139.99 and 137.52, resistance at 145.68.
Daily support at 139.38 and 138.31, resistance at 144.24.
Price broke below the 139.38 daily support level but rallied on Friday and managed to just finish positive last week. Will price form a lower top or advance to test the 144.24 daily resistance level this week?
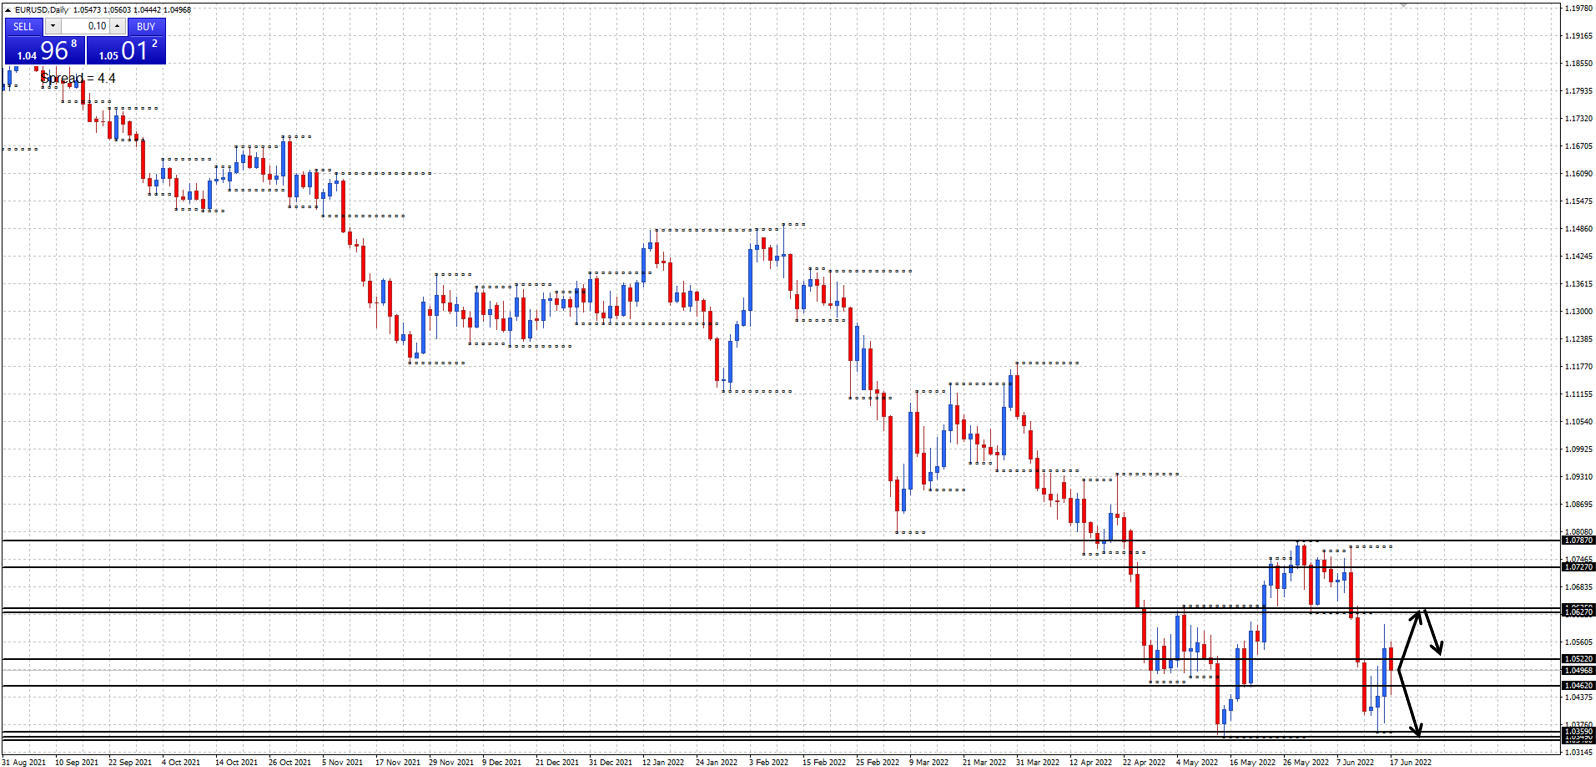
EUR/USD daily chart
Monthly support at 1.0462 and 1.0340, resistance at 1.0522 and 1.0635.
Weekly support at 1.0349, resistance at 1.0727 and 1.0787.
Daily support at 1.0359, resistance at 1.0627 and 1.0642.
Price closed below the 1.0522 monthly support level last week. Will price continue to decline and retest the 1.0340 monthly support level this week?
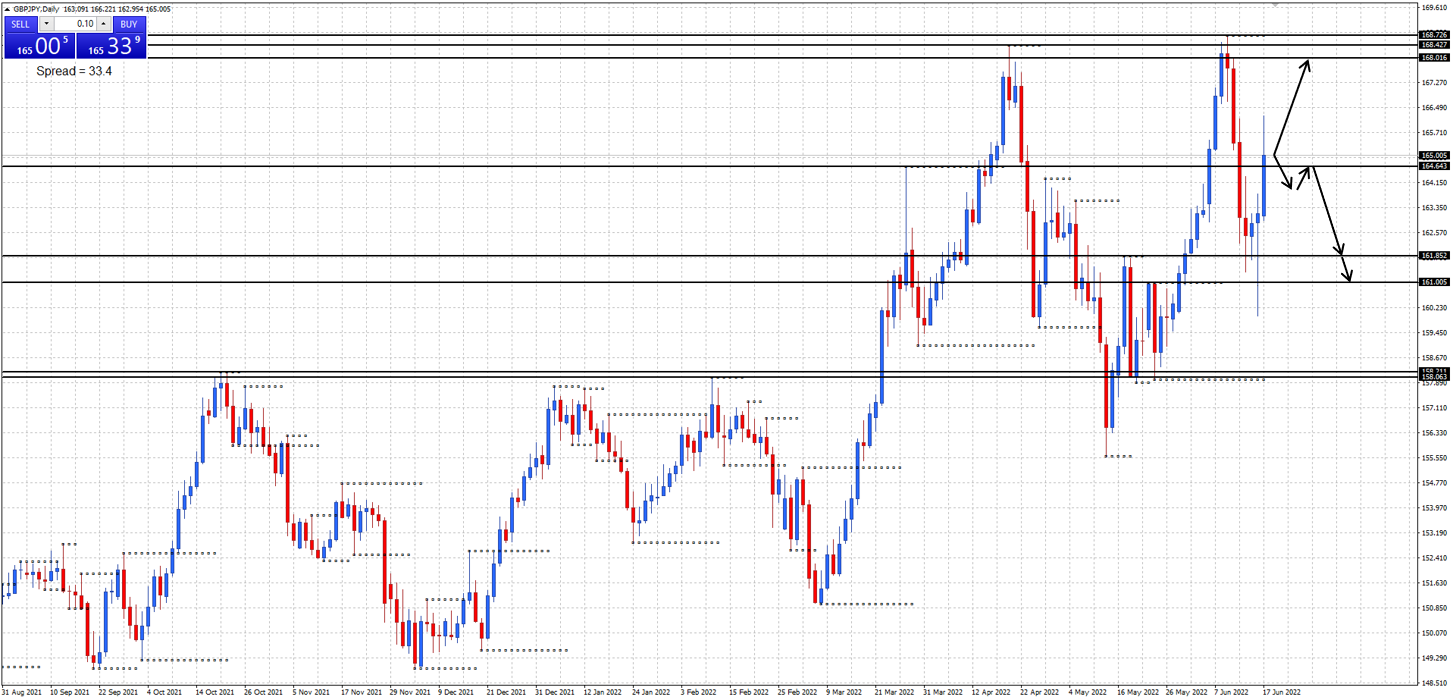
GBP/JPY daily chart
Monthly support at 158.21, resistance at 168.01.
Weekly support at 158.06, resistance at 168.42.
Daily support at 164.64, 161.85, and 161.00, resistance at 168.72.
Price closed above the 164.64 daily support/resistance level last week. Will price further advance or move back below the 164.64 support/resistance level and form a lower top this week?
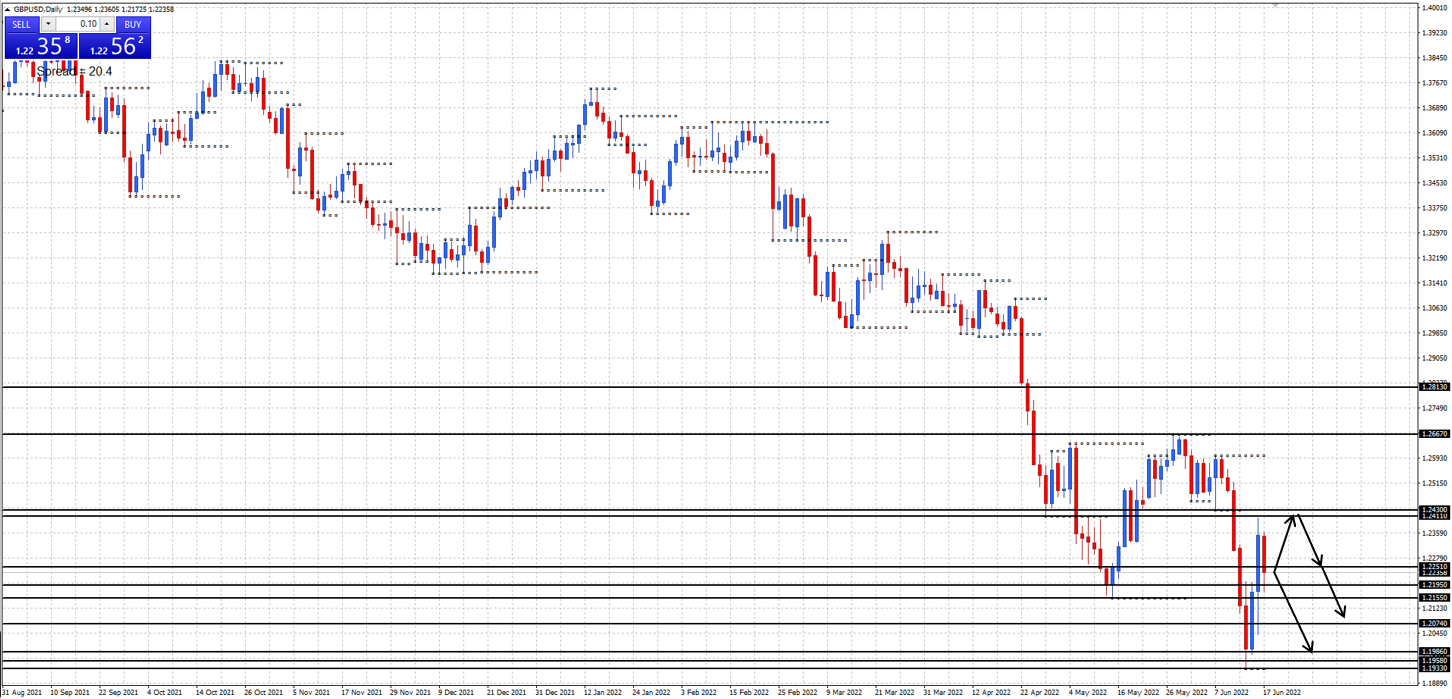
GBP/USD daily chart
Monthly support at 1.1986 and 1.1958.
Weekly support at 1.2251, 1.2195, 1.2155, and 1.2074, resistance at 1.2667 and 1.2813.
Daily support at 1.1933, resistance at 1.2411 and 1.2430.
Price strongly rallied from the 1.1986-58 monthly support levels last week. Will price continue to rally and test the 1.2411-30 daily resistance levels or decline and retest the 1.1986-58 monthly support levels this week?
Author

Duncan Cooper
ACY Securities
Duncan Cooper is a full-time trader and mentor. He has been actively trading the financial markets for more than 15 years and has traded stocks, options, futures, and the Forex Market since 2005.


