Karachi Stock Exchange (KSE-100) Elliott Wave Analysis

Karachi Stock Exchange from Pakistan (KSE-100 index) is a major stock market index which tracks the performance of largest companies by market capitalization from each sector of Pakistani economy listed on "The Karachi Stock Exchange". Since October 15th, 2012 it is a free-float index. The KSE100 has a base value of 1000 as of November 1991.
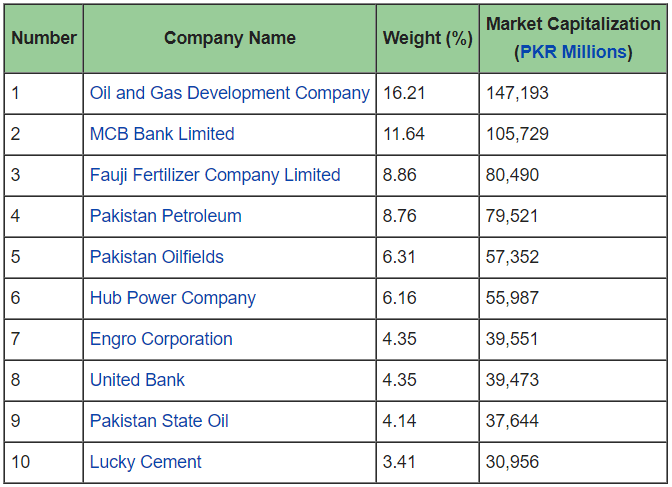
Top 10 KSE 100 Index Companies
Below is the list of top 10 companies with the largest market capitalization volume and their respective weighting in the index. These companies account for over 74% of the index as of July 2013.
Pakistan's Economic Outlook
Pakistan's economy is going through a boom & bust cycle that sees it back at the door of the International Monetary Fund (IMF). When the debt is soaring, the current account deficit is widening, reserves are falling and the currency has been devalued over 34% since the December 2017. High inflation is another challenge for Pakistan's economy, where the consumer price index has risen to the highest levels since 2013, inflation is way above the central bank's average forecast range of 6.5 percent to 7.5 percent for the year ending June. Due to which, some analysts are expecting another rate increase of 50-100 basis points in the short run.
The central bank has already raised the rates by cumulative 475 basis points since December 2018 to maintain the financial blowouts from Pakistan's current account deficit and balance of payment crisis. And now, Pakistan's' New government lead by PM Imran Khan is looking for 13th bailout package from IMF since the late 1980s looking to meet the current account & balance of payments crisis. However, the negotiations are still underway and delay in the agreement is causing the currency value, while local stocks are soaring to the lowest levels in three years. Causing the KSE-100 index to soar more than 10,000 points since the second quarter of 2018.
KSE-100 Technical Outlook
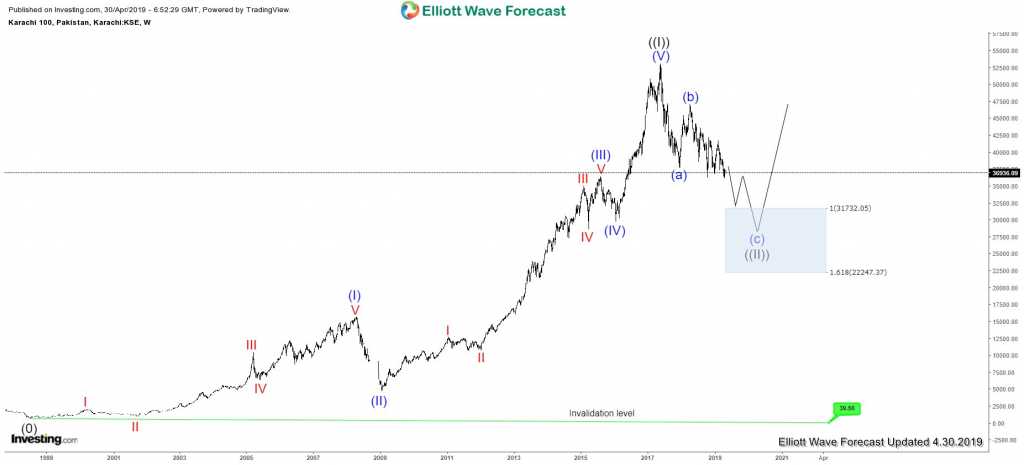
So now, let's take a quick look at the technical view of the KSE-100 index using Elliott wave theory. The index has ended the cycle from all time in Grand Super Cycle within wave ((I)) at 53127 high seen at 5/25/2017 peak. Since then, the index has made a strong pullback in the Grand Super Cycle wave ((II)). The pullback from 2017 peak is unfolding as zigzag structure looking to extend lower towards 31732-22247 100%-161.8% Fibonacci extension area. Then from there, the buyers are expected to appear in that blue box area looking for more upside or for bigger 3 wave reaction higher at least.
KSE-100 Weekly Elliott Wave View
Become a Successful Trader and Master Elliott Wave like a Pro. Start your Free 14 Day Trial at - Elliott Wave Forecast.
Author

Elliott Wave Forecast Team
ElliottWave-Forecast.com


